Download
1 / 11
110 likes | 125 Views
1999-2004. IRSN/BERSSIN. A. permanent GPS Seismic stations. B. P. ~25000 years old M>6 event. From Ghafiri, 1995. Adapted from Benedicto 1996. Return period (years) of M>=5 events. Moment rate (Nm/yr) slip rate (mm/yr) fault depth (km).

E N D
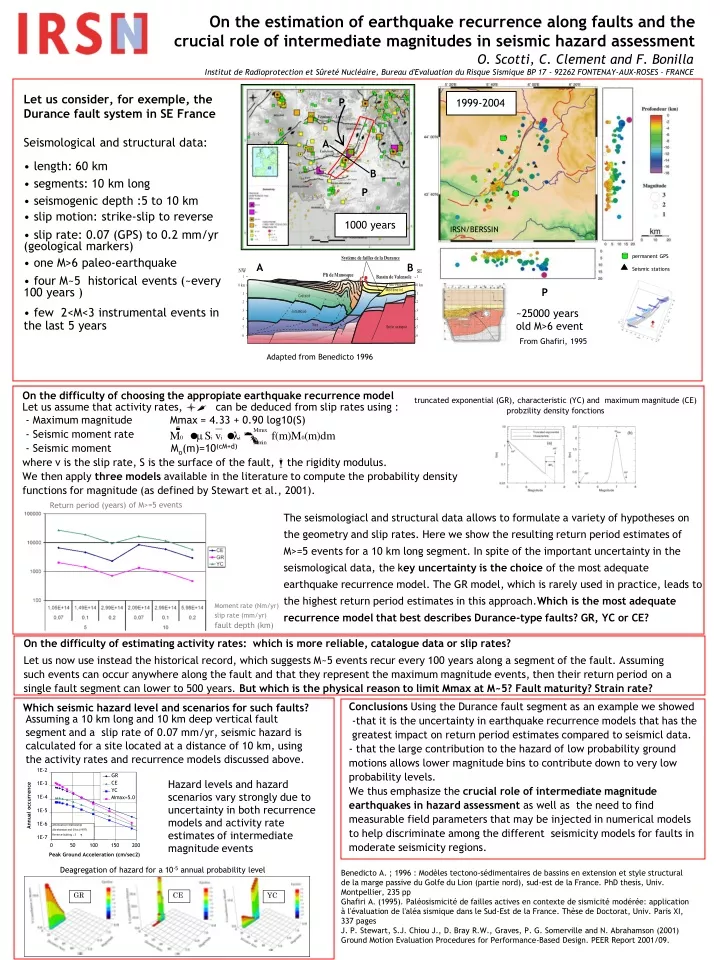
1999-2004 IRSN/BERSSIN A permanent GPS Seismic stations B P ~25000 years old M>6 event From Ghafiri, 1995 Adapted from Benedicto 1996 Return period (years) of M>=5 events Moment rate (Nm/yr) slip rate (mm/yr) fault depth (km) On the estimation of earthquake recurrence along faults and the crucial role of intermediate magnitudes in seismic hazard assessment O. Scotti, C. Clement and F. Bonilla Institut de Radioprotection et Sûreté Nucléaire, Bureau d'Evaluation du Risque Sismique BP 17 - 92262 FONTENAY-AUX-ROSES – FRANCE • Let us consider, for exemple, the Durance fault system in SE France • Seismological and structural data: • length: 60 km • segments: 10 km long • seismogenic depth :5 to 10 km • slip motion: strike-slip to reverse • slip rate: 0.07 (GPS) to 0.2 mm/yr (geological markers) • one M>6 paleo-earthquake • four M~5 historical events (~every 100 years ) • few 2<M<3 instrumental events in the last 5 years P A B P 1000 years On the difficulty of choosing the appropiate earthquake recurrence model Let usassume that activity rates, l, can be deduced from slip rates using : - Maximum magnitude Mmax = 4.33 + 0.90 log10(S) - Seismic moment rate - Seismic moment Mo(m)=10(cM+d) where v is the slip rate, S is the surface of the fault, m the rigidity modulus. We then applythreemodels available in the literature to compute the probability density functions for magnitude (as defined by Stewart et al., 2001). truncated exponential (GR), characteristic (YC) and maximum magnitude (CE) probzility density fonctions The seismologiacl and structural data allows to formulate a variety of hypotheses on the geometry and slip rates. Here we show the resulting return period estimates of M>=5 events for a 10 km long segment. In spite of the important uncertainty in the seismological data, the key uncertainty is the choice of the most adequate earthquake recurrence model. The GR model, which is rarely used in practice, leads to the highest return period estimates in this approach.Which is the most adequate recurrence model that best describes Durance-type faults? GR, YC or CE? On the difficulty of estimating activity rates: which is more reliable, catalogue data or slip rates? Let us now use instead the historical record, which suggests M~5 events recur every 100 years along a segment of the fault. Assuming such events can occur anywhere along the fault and that they represent the maximum magnitude events, then their return period on a single fault segment can lower to 500 years. But which is the physical reason to limit Mmax at M~5? Fault maturity? Strain rate? Conclusions Using the Durance fault segment as an example we showed -that it is the uncertainty in earthquake recurrence models that has the greatest impact on return period estimates compared to seismicl data. - that the large contribution to the hazard of low probability ground motions allows lower magnitude bins to contribute down to very low probability levels. We thus emphasize the crucial role of intermediate magnitude earthquakes in hazard assessment as well as the need to find measurable field parameters that may be injected in numerical models to help discriminate among the different seismicity models for faults in moderate seismicity regions. Which seismic hazard level and scenarios for such faults? Assuming a 10 km long and 10 km deep vertical fault segment and a slip rate of 0.07 mm/yr, seismic hazard is calculated for a site located at a distance of 10 km, using the activity rates and recurrence models discussed above. 1E-2 Hazard levels and hazard scenarios vary strongly due to uncertainty in both recurrence models and activity rate estimates of intermediate magnitude events GR CE 1E-3 YC 1E-4 Mmax=5.0 Annual occurrence 1E-5 1E-6 Attenuation relationship Abrahamson and Silva (1997) Reverse faulting ; 3 s 1E-7 0 50 100 150 200 Peak Ground Acceleration (cm/sec2) Deagregation of hazard for a 10-5 annual probability level Benedicto A. ; 1996 : Modèles tectono-sédimentaires de bassins en extension et style structural de la marge passive du Golfe du Lion (partie nord), sud-est de la France. PhD thesis, Univ. Montpellier, 235 pp Ghafiri A. (1995). Paléosismicité de failles actives en contexte de sismicité modérée: application à l'évaluation de l'aléa sismique dans le Sud-Est de la France. Thèse de Doctorat, Univ. Paris XI, 337 pages J. P. Stewart, S.J. Chiou J., D. Bray R.W., Graves, P. G. Somerville and N. Abrahamson (2001) Ground Motion Evaluation Procedures for Performance-Based Design. PEER Report 2001/09.
1999-2004 IRSN/BERSSIN permanent GPS Seismic stations 1000 years Moment rate (Nm/yr) fault depth (km) slip rate (mm/yr) 1E-2 GR CE 1E-3 YC 1E-4 Annual exceedance 1E-5 1E-6 s 1E-7 0 50 100 150 200 Peak Ground Acceleration (cm/sec2) On the estimation of earthquake recurrence along faults and the key role of intermediate magnitudes in estimatic seismic hazard O. Scotti, C. Clement and F. Bonilla The 4th International Workshop on Statistical Seismology 9-13 January 2006 Japan Institut de Radioprotection et Sûreté Nucléaire, Bureau d'Evaluation du Risque Sismique BP 17 - 92262 FONTENAY-AUX-ROSES – FRANCE Consider, for example, the seismological and tectonic setting of the Durance fault system in SE France Seismicity models for a given moment rate and geometry Choosing the appropriate earthquake recurrence model: GR,YC and/or CE? Input data: Geometry of segment 3 (M~6 vertical fault), slip rates (v) and a regional b-value Given Seismic moment rate: and Seismic moment: Mo(m)=10(cM+d) (S = segment surface; m =rigidity modulus; i=segment 3; M=magnitude) the activity rate (l) can be estimated by distributing the moment rate following the GR, YC and CErecurrence models. For acceptabledepth and slip rates hypothesis, resulting return period estimates vary by 50 to 80% a given recurrence model, Uncertainty in the choice of the recurrence model, however, reaches 100%. truncated exponential (GR) characteristic (YC) maximum magnitude (CE) Which model is more compatible with the seismicity catalogue? Return period (years) of M>=5 Less than 10 events of 2<M<3 have occured in 5 yrs along segment 3, 2 and 5; 4 M~5 historical events and one M~6 paleoearthquake on segment 3; segment 1 and 4 appear to be “inactive”. Although the seismicity record may not be sufficiently long to capture the steady-state behaviour of the entire fault system, the seismic behaviour of segment 3 appears more compatible with a GR-type recurrence model. Assuming the entire fault is active, should we apply the GR model to the other segments as well? Is this behaviour typical of low strain-rate faults? Alternatively, is the absence of seismicity evidence of their CE-character? Are there parameters other than seismicity that can be considered as indicative of each recurrence model? Conclusions Using the Durance fault as an example we showed that : 1. Using catalogues to estimate return periods of earthquakes in regions of moderate–to-low seismicity is delicate and subjected to the “hazard” of the catalogue window. 2. On the other hand, return periods of intermediate magnitude events estimated through slip rates and fault geometries depend strongly on the choice of the recurrence model. 3. Segment 3 appears to be more GR-like, but what can be said of the other segments? The GR model is the least commonly used recurrence model in seismic hazard assesment studies. Why? How to discriminate among the different seismicity models for Durance-type faults? Which are the key parameters? It is important to provide answers to these questions because: 3. Intermediate magnitude events contribute to the hazard down to very low probabilities due to the strong contribution of high epsilons. 4. Scenarios resulting from GR-models are very different than those resulting from YC or CE recurrence models. Impact of recurrence models and on seismic hazard estimations? Example of hazard curves for segment 3. Hazard is calculated for a 10 km distant site using the attenuation relationship of Abrahamson and Silva (1997), three recurrence models with Max=6.5 and = 2,09e+14 Nm/yr. Uncertainty in recurrence models, as well as in the estimation of “observed” activity rates combined with ground motion variability lead to great differences in hazard estimates and in the scenarii that contribute the most to the hazard. Deagregation of hazard for a given target level
Sismicité instrumentale sur la FMD Localisations 3D 1999-2004
2. Potentiel sismique de la FMD • 1. Paléosismologie • 2. Dimension de la faille • Segmentation • Géométrie 3D • Enracinement ? • 3. Vitesse de la faille Représentation simplifiée du système de failles FMD – support de modélisation - quantification
2. Potentiel sismique de la FMD Exemples d’études permettant de quantifier la vitesse de la faille • 1. Paléosismologie • 2. Dimension de la faille • Segmentation • Géométrie 3D • Enracinement ? • 3. Vitesse de la faille
CONCLUSION Sismicité régulière modérée M ~ 5 à 5,5 Vitesse de glissement par différentes approches de l’ordre de 1/10e mm/an Faille segmentée (10- 20 km) Magnitude >= 6,5 Conditionnée par la profondeur d’initiation de la rupture Période de retour des séismes majeurs de l’ordre de 10000 ans. ! On ne connaît pas le comportement des failles lentes. Si toute la faille casse, la magnitude peut atteindre 7. Période de retour plus longue
1999-2004 IRSN/BERSSIN P A permanent GPS Seismic stations B ~25000 years old M>6 event From Ghafiri, 1995 Adapted from Benedicto 1996 1000 years A B Let us consider, for example, the Durance fault system in SE France: Seismological and tectonic setting P P