Download
1 / 22
220 likes | 390 Views
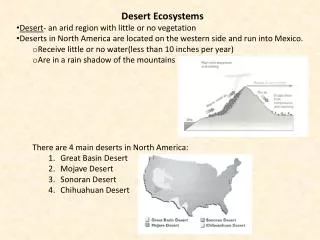
An Assessment of the Use of AMBER in a Semi-Arid Desert Region. Melissa A. Goering NOAA/NWS/Tucson, AZ. Paul Jendrowski NOAA/NWS/Honolulu, HI. Introduction. AMBER Background and Display Methods Flash Flood event: Douglas, Arizona on July 24, 2001 AMBER Limitations

E N D
An Assessment of the Use of AMBER in a Semi-Arid Desert Region Melissa A. Goering NOAA/NWS/Tucson, AZ Paul Jendrowski NOAA/NWS/Honolulu, HI
Introduction • AMBER Background and Display Methods • Flash Flood event: Douglas, Arizona on July 24, 2001 • AMBER Limitations • General Conclusions • TUS WFO verification for 2001 Monsoon season • Future work
Areal Mean Basin Estimated Rainfall • Uses Digital Hybrid Reflectivity Scan from WSR-88D on 1deg x 1 km to compute radar rainfall estimates for small scale drainage basins. • Average Basin Rainfall (ABR) is computed for individual range bins and averaged every volume scan. • ABR is summed to produce running accumulations for 6 alert periods (30 min, 45 min, 1 hr, 2 hr, 3 hr, and 6 hr) • Basin Rate of Accumulation (BRA) is the volume scan ABR divided by time between scans. • Comparisons area made between ABR and FFG for each time period to give an Alert Status. • Three display methods used at the TUS WFO.
AMBER in AWIPS D2D • Shows ABR for the six alert time periods and BRA • Gives forecasters quick display method of area and values BRA at 1634 MST Douglas, AZ
AlertWindow • Color coded Alert Status: • Green (< 60% of FFG) • Yellow (60-90% of FFG) • Red (90-150% of FFG) • Purple (>150% of FFG) • Browser allows users to view computed BR A and ABR values for each basin
AMBER ArcView Provides GIS capabilities and allows wide range of features: • Streets • Washes/Rivers • Towns/Cities • Flow Direction • Terrain
Flash Flood: July 24, 2001 Douglas AZ • Population of 19,500 • Thunderstorms developed over the Perilla Mountains and moved southwest towards Douglas • Heaviest precipitation fell between 1630 and 1700 MST • NO warning issued
Basin Rate of Accumulation 30 minute ABR 11646 18552 20796 11646 11646 18552 18552 9482 20796 20796 28716 9482 9482 28716 28716 28744 21582 7276 28744 28744 21582 21582 28792 7276 7276 28792 28792 Flash Flood: July 24, 2001 Douglas AZ Alert Status 1634 MST
Alert Status Basin Rate of Accumulation 30 minute ABR 18552 18552 18552 9482 9482 9482 20364 20364 20364 714 714 714 21582 21582 21582 7276 7276 7276 Flash Flood: July 24, 2001 Douglas AZ 1654 MST
Alert Status Basin Rate of Accumulation 30 minute ABR 20364 20364 20364 714 714 714 21582 21582 21582 7276 7276 7276 15414 15414 15414 Flash Flood: July 24, 2001 Douglas AZ 1714 MST
Flash Flood Aftermath: Douglas, AZ • Estimated 100,000 to 200,000 dollars in damage. • Some homes on northwest side of Douglas had 10 inches of standing water and few evacuations. • Levy on east side of town broke and retention pond undersized. • Four swift water rescues on northwest side of city. Basin 7276 graph at 1709 MST • Port Authority closed for 75 minutes and entry had 2 inches of standing water. • Severe winds caused windows to break and lifted a small utility shed from a backyard and onto a neighbors fence • Seveal residents rain gages received 4.0 inches of precipitation during 30 to 45 minute event.
AMBER Limitations • AMBER coverage is only from a single radar, thus will have the same limitations as the radar. • AMBER will be not be able to detect flash flood events in far western and northeastern portions of Tucson’s county warning area.
Verification from 2001 Monsoon Season • Improvement in POD and lead time. • Athough AMBER is not the entirely the reason for improvement on verification scores and lead time, it does have some effect.
Future Work • Work on FFG values for each basin (steepness of terrain, antecedent moisture, soil, etc) • Comparisons between : • AMBER and NSSL’s QIWI • AMBER and FFMP’s AMBER version • Statistical significance of AMBER’s effect on the verification scores
Flash Flood: August 14, 2001 Tucson AZ • AMBER was useful in the decision making process of issuing a flash flood warning. • 45 minute lead time • Silverbell Road between Ina and Camino del Cerro closed. • Heaviest precipitation fell between 1700 and 1800 MST.
Basin Rate of Accumulation Alert Status 29352 29352 7562 7562 11082 11082 5604 5604 11768 11768 29332 29332 2028 2028 13018 13018 Flash Flood: August 14, 2001 Tucson AZ 1728 MST
Basin Rate of Accumulation Alert Status 7562 7562 29340 29340 11082 11082 5604 5604 11768 11768 29332 29332 2028 2028 13018 13018 Flash Flood: August 14, 2001 Tucson AZ 1733 MST
Basin Rate of Accumulation Alert Status 29594 29594 29352 29352 7562 7562 3806 3806 11082 11082 5604 5604 11768 11768 Flash Flood: August 14, 2001 Tucson AZ 1758 MST
Flash Flood: July 5, 2001 Green Valley AZ • 15 minute lead time could have been increased by 10 or 12 minutes
Alert Status Basin Rate of Accumulation 18184 19314 18184 19314 2060 2060 28952 28952 Flash Flood: July 5, 2001 Green Valley AZ 1827 MST
Alert Status Basin Rate of Accumulation 28984 28984 18184 19314 18184 19314 2060 2060 28952 28952 Flash Flood: July 5, 2001 Green Valley AZ 1833 MST
Alert Status Basin Rate of Accumulation 28984 9578 28984 18184 9578 19314 18184 19314 2060 2060 28952 28952 Flash Flood: July 5, 2001 Green Valley AZ 1850 MST