Download
1 / 12
120 likes | 129 Views
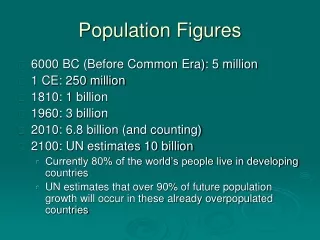
POPULATION FIGURES. World Population – 6.8 Billion United States – 310 Million Texas – 25 Million Houston – 4 Million. The World’s Population. If we could shrink the world’s population to a village of precisely 100 people, with all existing human ratios, it would look like this:.

E N D
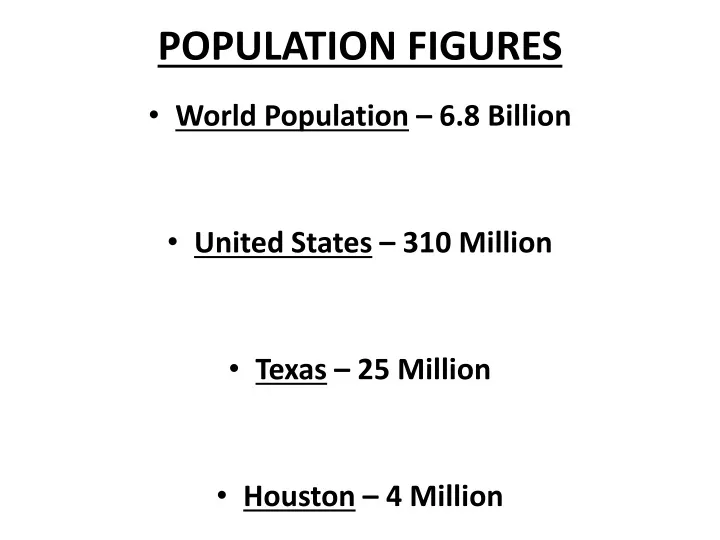
POPULATION FIGURES • World Population – 6.8 Billion • United States – 310 Million • Texas – 25 Million • Houston – 4 Million
The World’s Population • If we could shrink the world’s population to a village of precisely 100 people, with all existing human ratios, it would look like this: • There would be 57 ASIANS, 21 EUROPEANS, 14 from NORTH and SOUTH AMERICA (combined), and 8 AFRICANS … • 51 would be FEMALE; 49 would be MALE … • 70 would be NON-WHITE; 30 would be WHITE … • 70 would be NON-CHRISTIANS; 30 would be CHRISTIANS … • 50% of the world’s wealth would be in the hands of only 6 people, and all 6 would be citizens of the United States … • 80 would live in SUBSTANDARD housing … • 70 would be UNABLE to READ … • 50 would suffer from MALNUTRITION … • 1 would be near death, while 1 would be born … • Only 1 would have a college education.
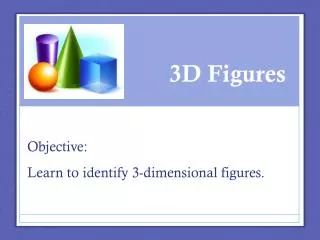
Population Pyramids
A POPULATION PYRAMID is special type of bar graph that shows the population of an area divided by age and gender.
The horizontal axis of the population pyramid shows the population in actual values or in percentages.
The vertical axis (sometimes it is on the side) shows you the age groups that are represented.
Making Your Own Population Pyramid • To make a population pyramid, use the following steps: • using your own sheet of paper, fold it (hamburger style) from top to bottom; • turn your paper sideways (binder holes at the bottom) and copy the following population pyramid outline; • copy the questions on the back of the population pyramid; • plot the data from the chart onto your outline; • use the chart to answer the questions on the back of the population pyramid.
% of Females % of Males 70 + 60 69 50 59 40 49 30 39 20 29 10 19 0 9 10 9 8 7 4 3 2 1 1 2 3 4 5 6 7 8 9 6 5 10
% of Females % of Males 70 + 60 69 50 59 40 49 30 39 20 29 10 19 0 9 10 9 8 7 4 3 2 1 1 2 3 4 5 6 7 8 9 6 5 10