Download
1 / 14
140 likes | 277 Views
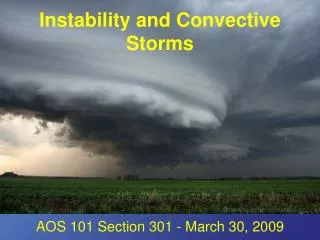
The Correlation between Convective Storms and Carbon Monoxide Distribution in the Troposphere. A qualitative investigation of AIRS data by Jeremy Halland. NASA’s Aqua Satellite. Sun-synchronous polar orbiting satellite at 705 km above the Earth’s surface AIRS (Atmospheric Infrared Sounder)

E N D
The Correlation between Convective Storms and Carbon Monoxide Distribution in the Troposphere A qualitative investigation of AIRS data by Jeremy Halland
NASA’s Aqua Satellite • Sun-synchronous polar orbiting satellite at 705 km above the Earth’s surface • AIRS (Atmospheric Infrared Sounder) • Spectral coverage between 3.7μm and 15.4μm • Carbon Monoxide absorption line at 4.67μm • AMSU (Advanced Microwave Sensing Unit) • Used for cloud clearing process *Image from http://airs.jpl.nasa.gov/index.html
Carbon Monoxide Measurements • A temperature profile is found by measuring emissions at multiple wavelengths surrounding the 667 cm-1 CO2 absorption line and 50 GHz Oxygen absorption line (by AIRS and AMSU) • With the temperature profile known, emissions at 4.67μm are measured and the CO profile can be made because the emitted energy is a function of temperature and density at a specific pressure Diagram from: http://www.eos.ucar.edu/mopitt/instr/instr.html
What is Carbon Monoxide? • Formed from incomplete combustion of fuels like: • coal, wood, natural gas, and fossil fuels • Sources include: • Automobile emissions (77% of the US’s CO from this alone) • Industrial Facilities • Wildfires • Carbon Monoxide density decreases with altitude • CO has damaging effects on plant, animal and human life. • Tropospheric ozone is formed from reactions of CO with sunlight and other gases in the atmosphere.
The Investigation…. • During the Alaskan wildfires of 2004, multiple regions of one square degree would have CO values 15-30% higher than the surrounding area • I am investigating the most likely mechanism for these high CO density measurements
12 July 2004: 300 hPa CO mixing ratio (ppbv) 12 July 2004: 500 hPa CO mixing ratio (ppbv)
12 July 2004: 300 hPa CO mix. rat. at 0841 UTC & Radar at 1000 UTC 12 July 2004: 300 hPa CO mix. rat. at 0841 UTC & Radar at 0830 UTC Radar Before Satellite Overpass Radar After Satellite Overpass
13 July 2004: 500 hPa CO mixing ratio (ppbv) 13 July 2004: 300 hPa CO mixing ratio (ppbv)
13 July 2004: 300 hPa CO mix. rat. at 0611 UTC & Radar at 0100 UTC
13 July 2004: 300 and 750 hPa CO mix. rat. at 0747 UTC & Radar at 0730 UTC
14 July 2004: 300 hPa CO mixing ratio (ppbv) 14 July 2004: 500 hPa CO mixing ratio (ppbv)
14 July 2004: 500 hPa CO mix. rat. at 1930 UTC & IR Satellite at 1913 UTC 14 July 2004: 750 hPa CO mix. rat. at 1930 UTC & IR Satellite at 1913 UTC 14 July 2004: 300 hPa CO mix. rat. at 1930 UTC & IR Satellite at 1913 UTC
Conclusions • The strong updrafts associated with both severe and non-severe thunderstorms acts as a transport of high density CO at the surface to higher levels in the troposphere • This explains the higher measurements made in regions with otherwise average CO values