Download
1 / 23
230 likes | 327 Views
Screen. Cabinet. Cabinet. Lecturer’s desk. Table. Computer Storage Cabinet. Row A. 3. 4. 5. 19. 6. 18. 7. 17. 16. 8. 15. 9. 10. 11. 14. 13. 12. Row B. 1. 2. 3. 4. 23. 5. 6. 22. 21. 7. 20. 8. 9. 10. 19. 11. 18. 16. 15. 13. 12. 17. 14. Row C. 1. 2.

E N D
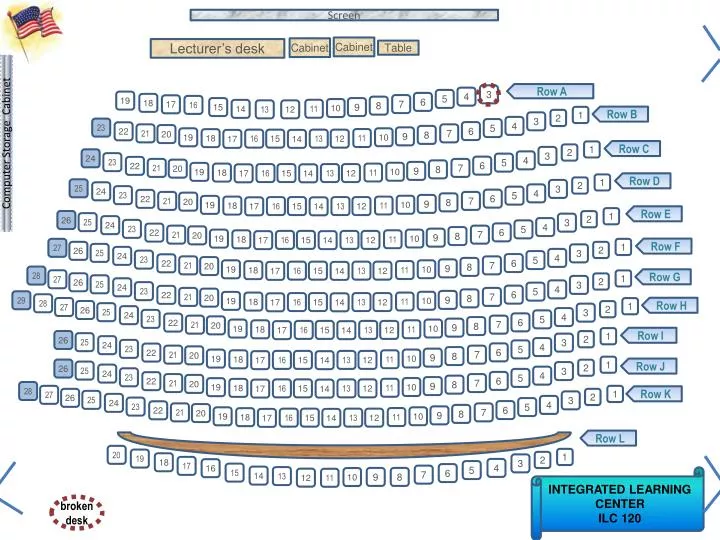
Screen Cabinet Cabinet Lecturer’s desk Table Computer Storage Cabinet Row A 3 4 5 19 6 18 7 17 16 8 15 9 10 11 14 13 12 Row B 1 2 3 4 23 5 6 22 21 7 20 8 9 10 19 11 18 16 15 13 12 17 14 Row C 1 2 3 24 4 23 5 6 22 21 7 20 8 9 10 19 11 18 16 15 13 12 17 14 Row D 1 2 25 3 24 4 23 5 6 22 21 7 20 8 9 10 19 11 18 16 15 13 12 17 14 Row E 1 26 2 25 3 24 4 23 5 6 22 21 7 20 8 9 10 19 11 18 16 15 13 12 17 14 Row F 27 1 26 2 25 3 24 4 23 5 6 22 21 7 20 8 9 10 19 11 18 16 15 13 12 17 14 28 Row G 27 1 26 2 25 3 24 4 23 5 6 22 21 7 20 8 9 29 10 19 11 18 16 15 13 12 17 14 28 Row H 27 1 26 2 25 3 24 4 23 5 6 22 21 7 20 8 9 10 19 11 18 16 15 13 12 17 14 Row I 1 26 2 25 3 24 4 23 5 6 22 21 7 20 8 9 10 19 11 18 16 15 13 12 17 14 1 Row J 26 2 25 3 24 4 23 5 6 22 21 7 20 8 9 10 19 11 18 16 15 13 12 17 14 28 27 1 Row K 26 2 25 3 24 4 23 5 6 22 21 7 20 8 9 10 19 11 18 16 15 13 12 17 14 Row L 20 1 19 2 18 3 17 4 16 5 15 6 7 14 13 INTEGRATED LEARNING CENTER ILC 120 9 8 10 12 11 broken desk
Introduction to Statistics for the Social SciencesSBS200, COMM200, GEOG200, PA200, POL200, or SOC200Lecture Section 001, Fall, 2013Room 120 Integrated Learning Center (ILC)10:00 - 10:50 Mondays, Wednesdays & Fridays. Welcome http://www.youtube.com/watch?v=oSQJP40PcGI
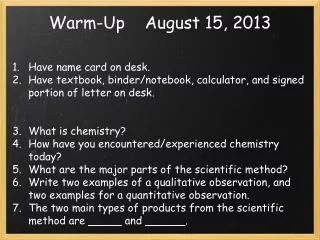
Homework due – Monday (October 21st) On class website: Dan Gilbert Reading Please click in My last name starts with a letter somewhere between A. A – D B. E – L C. M – R D. S – Z
Use this as your study guide By the end of lecture today10/16/13 Connecting probability, proportion and area of curve Percentiles Probability of an eventComplement of the probability of an event Mutually exclusive characteristics Collectively Exhaustive Events Union and Intersection of two events Special Law of Addition Conditional Probabilities Central Limit Theorem
Exam 2 – This Friday (10/18/13) Study guide is online now Bring 2 calculators (remember only simple calculators,we can’t use calculators with programming functions) Bring 2 pencils (with good erasers) Bring ID Review Session Thursday at 7:00 Modern Languages Room 311
Schedule of readings Before next exam (October 18th) Please read chapters 5, 6, & 8 in Ha & Ha Please read Chapters 10, 11, 12 and 14 in Plous Chapter 10: The Representativeness Heuristic Chapter 11: The Availability Heuristic Chapter 12: Probability and Risk Chapter 14: The Perception of Randomness
Lab sessions Labs continue this week
Homework review 2 = .40 5 Based on apriori probability – all options equally likely – not based on previous experience or data Based on expert opinion - don’t have previous data for these two companies merging together Based on frequency data (Percent of rockets that successfully launched)
Homework review Based on apriori probability – all options equally likely – not based on previous experience or data 30 = .30 100 Based on frequency data (Percent of times at bat that successfully resulted in hits) Based on frequency data (Percent of times that pages that are “fake”)
Homework review Based on frequency data (Percent of students who successfully chose to be Economics majors) 5 = .10 50
. .8276 .1056 .2029 .1915 .3944 .4332 .3944 .3944 55 55 55 52 44 50 50 44 - 50 4 52 - 50 4 -1.5 +.5 = = 55 - 50 4 +1.25 = z of 1.5 = area of .4332 z of 1.5 = area of .1915 1.25 = area of .3944 55 - 50 4 55 - 50 4 +1.25 +1.25 = = .5000 - .3944 = .1056 z of 1.25 = area of .3944 z of 1.25 = area of .3944 .4332 +.3944 = .8276 .3944 -.1915 = .2029
.3264 Homework review .2152 .5143 .1255 .3888 .1736 .1736 .3888 3,000 3,500 2,500 3,500 3,000 2500 - 2708 650 3000 - 2708 650 3000 - 2708 650 -.32 = 0.45 0.45 = = z of -0.32 = area of .1255 z of 0.45 = area of .1736 z of 0.45 = area of .1736 3500 - 2708 650 3500 - 2708 650 1.22 = 1.22 = .5000 - .1736 = .3264 z of 1.22 = area of .3888 z of 1.22 = area of .3888 .3888 +.1255= .5143 .3888 - .1736 = .2152
.0764 Homework review .9236 .1185 .4236 .4236 .4236 .3051 10 12 20 20 10 - 15 3.5 -1.43 = 20 - 15 3.5 20 - 15 3.5 1.43 1.43 = = z of -1.43 = area of .4236 z of 1.43 = area of .4236 z of 1.43 = area of .4236 12 - 15 3.5 -0.86 = .5000 + .4236 = .9236 .5000 - .4236 = .0764 z of -.86 = area of .3051 .4236 – .3051 = .1185
X X X X X X X X X X X X X X X X X X X X X X X X X X X X X X X X X X X X X X X Sampling distribution for continuous distributions • Central Limit Theorem: If random samples of a fixed N are drawn • from any population (regardless of the shape of the • population distribution), as N becomes larger, the • distribution of sample means approaches normality, with • the overall mean approaching the theoretical population • mean. Distribution of Raw Scores Sampling Distribution of Sample means Melvin 23rd sample Eugene X X X X X 2nd sample
Central Limit Theorem Proposition 1: If sample size (n) is large enough (e.g. 100) The mean of the sampling distribution will approach the mean of the population As n ↑ x will approach µ Proposition 2: If sample size (n) is large enough (e.g. 100) The sampling distribution of means will be approximately normal, regardless of the shape of the population As n ↑ curve will approach normal shape Proposition 3: The standard deviation of the sampling distribution equals the standard deviation of the population divided by the square root of the sample size. As n increases SEM decreases. As n ↑ curve variability gets smaller X X X X X X X X X X X X X X X X X X X X X X X X X X X X X X X X X X X X X X X X X X X X
Central Limit Theorem: If random samples of a fixed N are drawn from any population (regardless of the shape of the population distribution), as N becomes larger, the distribution of sample means approaches normality, with the overall mean approaching the theoretical population mean. Distribution of Raw Scores Animation for creating sampling distribution of sample means Distribution of single sample Eugene Melvin Sampling Distribution of Sample means Sampling Distribution of Sample means Mean for sample 12 Mean for sample 7 http://onlinestatbook.com/stat_sim/sampling_dist/index.html
. Writing Assignment: Writing a letter to a friend • Imagine you have a good friend (pick one). This is a good friend whom you consider to be smart and interested in stuff generally. They are teaching themselves stats (hoping to test out of the class) but need your help on a couple ideas. For this assignment please write your friend/mom/dad/ favorite cousin a letter answering these five questions: (Feel free to use diagrams and drawings if you think that can help) • Dear Friend, • 1. I’m struggling with this whole Central Limit Theorem idea. Could you • describe for me the difference between a distribution of raw scores, and a • distribution of sample means? • 2. I also don’t get the “three propositions of the Central Limit Theorem”. They all • seem to address sample size, but I don’t get how sample size could affect • these three things. If you could help explain it, that would be really helpful.
. • Imagine you have a good friend (pick one). This is a good friend whom you consider to be smart and interested in stuff generally. They are teaching themselves stats (hoping to test out of the class) but need your help on a couple ideas. For this assignment please write your friend/mom/dad/ favorite cousin a letter answering these five questions: (Feel free to use diagrams and drawings if you think that can help) • Dear Friend, • 1. I’m struggling with this whole Central Limit Theorem idea. Could you • describe for me the difference between a distribution of raw scores, and a • distribution of sample means? • 2. I also don’t get the “three propositions of the Central Limit Theorem”. They all • seem to address sample size, but I don’t get how sample size could affect • these three things. If you could help explain it, that would be really helpful.
Thank you! See you next time!!