Download
1 / 13
130 likes | 258 Views
Analysis of the Blood Perfusion and Perspiration Components of the Supraorbital Thermal Signature. Adina-Raluca Stoica Dvijesh Shastri, Ioannis Pavlidis. Introduction Methodology Experimental Results Conclusions Questions. Project Motivation My Role in the Project. Project Motivation.

E N D
Analysis of the Blood Perfusion and Perspiration Components of the Supraorbital Thermal Signature Adina-Raluca Stoica Dvijesh Shastri, Ioannis Pavlidis
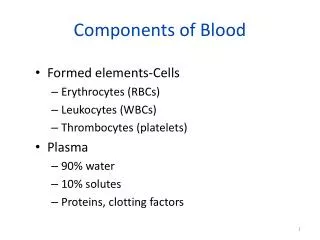
Introduction • Methodology • Experimental Results • Conclusions • Questions • Project Motivation • My Role in the Project Project Motivation • To develop an algorithm to extract thermal signals from the three key facial areas of symathetic importance: • Supraorbital • Periorbital • Maxillary • Research Requirements: • Accurate and consistent physiological measurements • The segmentation method should be flexible enough to adapt to physiological changes • Research Applications: • Stress analysis in surgical training, lie detection, office stress analysis
Analysis of the supraorbital area via 2D Wavelet, as • It presents two non-overlapping components in spatial domain: • Blood flow (Low resolution) • Perspiration (High resolution) • Introduction • Methodology • Experimental Results • Conclusions • Questions • Project Motivation • My Role in the Project My Role in the Project My research problem: Can we separate these components and analyze them separately? Yes: Use 2D wavelet analysis to separate the components. Frame 1100 Frame 3184 Blood Flow & Perspiration Blood Flow 1. Perspiration: Texture analysis based on statistical approaches 2. Blood flow: Future work
Done on frames 1100 (blood flow information) and 3184 (blood flow and perspiration information) • Introduction • Methodology • Experimental Results • Conclusions • Questions • Preliminary Analysis • Data Preparation • Formulas Preliminary Analysis “Did you ever take something from a place you worked at?” Blood Flow & Perspiration Blood Flow
Introduction • Methodology • Experimental Results • Conclusions • Questions • Preliminary Analysis • Data Preparation • Formulas Data Preparation • Step 1: Localize and extract the supraorbital area out of the image • Step 2: Apply 1st Level 2D Haar wavelet * transform on the region, obtaining: • Approximation component (Low resolution component, cA) • Detail components (High resolution components) • Horizontal Details (cH) • Vertical Details (cV) • Diagonal Details (cD) 2D Haar Frame 1100 cA D Frame 3184 cA D cH cH cD cD cV cV Blood Flow & Perspiration Blood Flow • Step 3:Visualize the wavelet energy components • * We used MatLab’s Wavelet Toolbox
Introduction • Methodology • Experimental Results • Conclusions • Questions • Preliminary Analysis • Data Preparation • Formulas Formulas • Step 4: Analyze perspiration component through the statistical approach: use the statistical moment of the intensity histogram of the region *Where, z denotes intensity, p(z) is the corresponding histogram (number of pixels with that intensity/total number of pixels), and L is the number of distinct intensity levels
Approximation Energy Component • Introduction • Methodology • Experimental Results • Conclusions • Questions Results (Visualization) • Results (Visualization) • Results • Observations • Detailed Energy Diagonal Component • Detailed Energy Vertical Component • Detailed Energy Horizontal Component • The detailed component reveals the perspiration information • The approximation component reveals evolution of blood flow information
Introduction • Methodology • Experimental Results • Conclusions • Questions Results • Results (Visualization) • Results • Observations
Conclusions • Future Work • References • The 2D wavelet analysis shows potential to separate blood flow (low resolution phenomena) from perspiration (high resolution phenomena) • The statistical approach works well to identify perspiration rich frames form the thermal videos • Introduction • Data Analysis • Conclusions • Future Work • References Conclusions
Introduction • Methodology • Experimental Results • Conclusions • Questions? • Conclusions • Future Work • References Future Work • Week-8 [July 21-25]: • More analysis is necessary for statistical approach • Blood flow analysis • Week-9 [July 28-August 1]: • Apply preliminary analysis on thermal videos , which consist of more than 10,000 frames • Blood flow analysis • Week-10 [August 4-August 8]: • Wrap up + Report + Poster + Final Presentation
Imaging Facial Signs of Neuro-Physiological Responses (Dvijesh Shastri, Arcancelo Merla, Panagiotis Tsiamyrtzis, Ioannis Pavlidis) • Wavelets For Texture Analysis, An Overview (S. Livens, P. Scheunders, G. van de Wouwer, D. Van Dyck) • Digital Image Processing by R.C. Gonzalez, 3rd Edition, pp 827-856 • MatLab Help • Wavelet Based Automatic Thresholding For image Segmentation (Xiao-Ping Zhang, Mita D. Desai) • Wavelet Based image Segmentation (Andrea Gavlasova, Ales Prochazka, Martina Mudrova) • Wavelet-Based Image Segmentation. Feature Recognition in Noise-Distorted Biomedical images (Joerg Meyer, Zhihe Zhang) • Bayesian Image Segmentation Using Wavelet-Based Priors (Mário A. T. Figueiredo) • Introduction • Methodology • Experimental Results • Conclusions • Questions? • Conclusions • Future Work • References References
Questions and Comments • Questions and Comments • Introduction • Methodology • Experimental Results • Conclusions • Questions? Questions?
Introduction • Methodology • Experimental Results • Conclusions • Questions Observations • Results (Visualization) • Results • Observations • By computing the descriptors on different components of the image (obtained through the wavelet transform), more significant results are obtained • By combining the results through taking the square root of the sum of the squares of each component descriptor (linear combination), the results obtained are more comparable than by just applying the descriptors on the image (see uniformity)