Download
1 / 21
210 likes | 220 Views
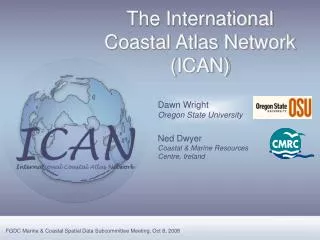
The Coastal Atlas Flanders/Belgium 2. Kathy Belpaeme & Sofie Vanhooren Coordination Centre on ICZM Belgium ICAN 5, 31 August 2011, Ostend. Content. History of the Belgian Coastal Atlas Inspiration for a new atlas: users workshop + small scale test Update of the site: what’s new?

E N D
The Coastal Atlas Flanders/Belgium 2 Kathy Belpaeme & Sofie Vanhooren Coordination Centre on ICZM Belgium ICAN 5, 31 August 2011, Ostend
Content • History of the Belgian Coastal Atlas • Inspiration for a new atlas: users workshop + small scale test • Update of the site: what’s new? • Facts & figures • A new publication as well • Linkage to ICZM
Inspirationfor a new atlas: users workshop results • portal site, communication tool => demonstratecomplexity of coast • Present keyfigures per sector • Easy navigation is important • target audience: coastalactors, broad public. Notinternalwithingovernment • more info about the marine environment & land-sea interface • cartography = main feature. Focus on “easy to use”, static mapson entry; interactivityfor more advancedusers. - Alsopublishupdatedbook! • Integrateinstruments: indicators, coastalwiki, coastal codex (legislation)
Smallscale test of the kustatlas • A smallscale test was held amongs different target user groups: teacher, guide, touristic sector, Flemishadministration, museum, student, scientist, … • Testing user friendliness of the site and use of the interactive part of the atlas • More onthistomorrow at 1:30 pm! CONCLUSION: Verypositive and enthousiastic feedback on the interactive part of the kustatlas! Users have concrete ideas in using the interactive map fortheir sector. Results of the workshops and the test were taken into account when updating the new website and book
C-SCOPE project: starting shot for a newupdated kustatlas online • Interreg IV A project, partners: Coordination Centre for ICZM, Belgium (lead partner) and DorsetCountyCounsil (UK) • Total Budget: 1.791.188 EUR • Total amount of Europeanfunding: 895.594 EUR (50%)
Scientistusers: needdetailed and complex information • Policy and decision maker users: selectedinformation • Educationalusers: ready-to-useeducationalpackages • Public users: easilyaccessible and transparentbasicinformation • (Marine) industry • Everybodywho’sinterested in the Coast! Who is our target audience?
The website: www.coastalatlas.be: update 2011 • Portal forcoastalinformationfor a broadaudience • communication tool oncomplexity of the coast, onlower level alsopolicysupporting tool • Same thematic approach: 13 themes, 168 subthemes • Linkingpolicy to eachchapter
Strong phocus on easy cartography: • upgrading in interactivity: manylayersforeseenfor all 13 thematic chapters, to beclickedon and off • In eachchapter, somelayers are standardon • consideringland-sea interface • Printing and downloadingpossible (free availability of shape files forsomemaps) • Unique mapsnowhereelseavailable
Strong phocuson easy cartography: selection of ready-to-usemaps
Integrating a rich set of data in the Kustatlas: sustainability indicators • 21 indicators grouped in 7 chapters • Insightabout state of the coast and • sustainability of itsdevelopment • Policy support tool for coastal managers • Indicator outputs: graphs and tables Source: FOD Economie Source: FOD Economie
Possibility to download maps and available data (graphs, tables, …): Downloads of pdf’s, excel files, pictures
Facts & figures via Google Analytics • Average time spendon site: • 9 June-26 Aug 2011: 4min30 • 2008: 2min46 • Almost 18% go to the site more thanonce, 75% visit more than 1 page (9 June-26 Aug 2011) • Top 5 downloaded pages: • Homepage • Interactive map • Themegeneral setting • Downloads • Themetourism and recreation
Facts & Figures (9 May-26 August) Jan/May 2011 • How is the website found? • Top 3 of visitingcountries: Belgium, the Netherlands, France (9 May11/26 August11) • 43 countriesvisited the site (9 May11/26 August11) 9/5/11 / 26/8/11
The book: ‘Coastal Atlas Flanders/Belgium’ • New maps • New chapters • Innovativephotography • Dutch/English More this evening at 6 pm!
Linkage to ICZM • Coastal atlas: awarenessraising tool for a wide public about the complexity of the coast • Coastal sustainability indicators pursue effective policies for the coast, integrated data and maps are provided • Analysis of the 27 ICZM indicators by linking to the SAIL project website • Coastal Atlas is a tool forgiving the civilianaccess to information of the government, itspolicy and itsscientificorganizations • For coastal communities: giving the civilian access to policy information • Useful information on the seaside and consideration of land-sea interface
With special thanks to the entire Task Group for the Belgian Coastal Atlas: MDK, Afd.Kust, Vlaamse Hydrografie – VLIZ - KBIN/BMM –AGIV – GIS West – VMM – Provincie West-Vlaanderen - WES – MOW, Haven- en waterbeleid – Horizon Educatief – FOD Leefmilieu - Westtoer – UGent – ANB
Thanks to our funding partners and all our coastal stakeholders