Download
1 / 33
450 likes | 1.19k Views
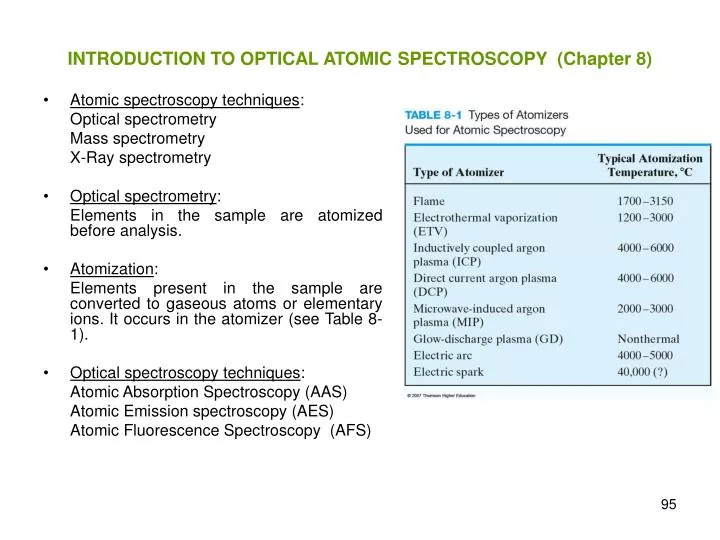
INTRODUCTION TO OPTICAL ATOMIC SPECTROSCOPY (Chapter 8). Atomic spectroscopy techniques : Optical spectrometry Mass spectrometry X-Ray spectrometry Optical spectrometry : Elements in the sample are atomized before analysis. Atomization :

E N D
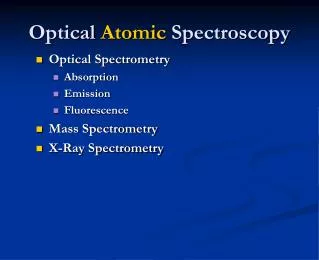
INTRODUCTION TO OPTICAL ATOMIC SPECTROSCOPY (Chapter 8) • Atomic spectroscopy techniques: • Optical spectrometry • Mass spectrometry • X-Ray spectrometry • Optical spectrometry: • Elements in the sample are atomized before analysis. • Atomization: • Elements present in the sample are converted to gaseous atoms or elementary ions. It occurs in the atomizer (see Table 8-1). • Optical spectroscopy techniques: • Atomic Absorption Spectroscopy (AAS) • Atomic Emission spectroscopy (AES) • Atomic Fluorescence Spectroscopy (AFS)
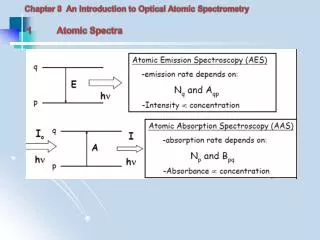
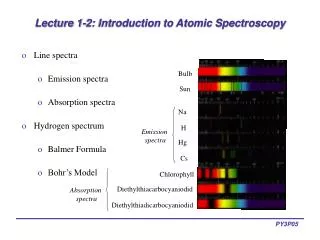
Optical Atomic Spectra • Figure 8-1a shows the energy level diagram for sodium. • A value of zero electron volts (eV) is arbitrarily assigned to orbital 3s. • The scale extends up to 5.14eV, the energy required to remove the single 3s electron to produce a sodium ion. 5.14eV is the ionization energy. • A horizontal line represents the energy of and atomic orbital. • “p” orbitals are split into two levels which differ slightly in energy: • 3s → 3p: l = 5896Å or 5890Å • 3s → 4p: l = 3303Å or 3302Å • 3s → 5p: l = 2853.0Å or 2852.8Å • There are similar differences in the d and f orbitals, but their magnitudes are usually so small that are undetectable, thus only a single level is shown for orbitals d. Spin-orbit coupling
Multiplicity: number of possible orientations of the resultant spin angular momentum = 2S +1
Widths of atomic lines are quite important in atomic spectroscopy. Narrow lines in atomic and emission spectra reduce the possibility of interference due to overlapping lines. Atomic absorption and emission lines consists of a symmetric distribution of wavelengths that centers on a mean wavelength (l0) which is the wavelength of maximum absorption or maximum intensity for emitted radiation. The energy associated with l0 is equal to the exact energy difference between two quantum states responsible for absorption or emission. A transition between two discrete, single-valued energy states should be a line with line-width equal to zero. However, several phenomena cause line broadening in such a way that all atomic lines have finite widths. Line width or effective line width (Dl1/2) of an atomic absorption or emission line is defined as its width in wavelength units when measured at one half the maximum signal. Atomic Line Widths • Sources of broadening: • Uncertainty effect • Doppler effect • Pressure effects due to collisions • Electric and magnetic field effects
It results from the uncertainty principle postulated in 1927 by Werner Heisenberg. One of several ways of formulating the Heisenberg uncertainty principle is shown in the following equation: Dt x DE = h The meaning in words of this equation is as follows: if the energy E of a particle or system of particles – photons, electrons, neutrons or protons – is measured for an exactly known period of time Dt, then this energy is uncertain by at least h/ Dt. Therefore, the energy of a particle can be known with zero uncertainty only if it is observed for an infinite period of time. For finite periods, the energy measurement can never be more precise then h/ Dt. The lifetime of a ground state is typically long, but the lifetimes of excited states are generally short, typically 10-7 to 10-8 seconds. Line widths due to uncertainty broadening are called natural line widths and are generally 10-5nm or 10-4Å. Uncertainty Effect Note: Dl = Dl1/2
In a collection of atoms in a hot environment, such as an atomizer, atomic motions occur in every direction. The magnitude of the Doppler shift increases with the velocity at which the emitting or absorbing species approaches or recedes the detector. For relatively low velocities, the relationship between the Doppler shift (Dl) and the velocity (v) of an approaching or receding atom is given by: Dl / l0= v / c Where l0 is the wavelength of an un-shifted line of a sample of an element at rest relative to the transducer, and c is the speed of light. Emitting atom moving: (a) towards a photon detector, the detector sees wave crests more often and detect radiation of higher frequency; (b) away from the detector, the detector sees wave crests less frequently and detects radiation at lower frequency. The result is an statistical distribution of frequencies and thus a broadening of spectral lines. Doppler Effect Dl
Pressure or collisional broadening is caused by collisions of the emitting or absorbing species with other atoms or ions in the heated medium. These collisions produce small changes in energy levels and hence a range of absorbed or emitted wavelengths. These collisions produce broadening that is two to three orders of magnitude grater than the natural line widths. Example: Hollow-cathode lamps (HCL): Pressure in these lamps is kept really low to minimize collisional broadening. Glass tube is filled with neon or argon at a pressure of 1 to 5 torr. lA lA’ lE lE’ E2 E2 E1 Energy (eV) E1 Atom 1 Atom 2 Pressure Effects Due to Collisions
Temperature in the atomizer has a profound effect on the ratio between the number of excited an unexcited atomic particles. The magnitude of this effect is calculated with the Boltzmann distribution equation: Nj / N0 = (gj / g0) x [exp(-Ej/kT)] where: - Nj and N0 are the number of atoms in the excited state and ground state, respectively - k is the Boltzmann’s constant - T is absolute temperature (K) - Ej is the energy difference between the excited and the ground state. - gi and g0 are statistical factors called statistical weights determined by the number of states having equal energy at each quantum level. Example shows that a temperature fluctuation of only 10K results in a 4% increase in the number of excited sodium atoms. A corresponding increase in emitted power by the two lines would result. An analytical method based on the measurement of emission requires close control of atomization temperature. The Effect of Temperature on Atomic Spectra
When atomic line spectra are generated, both band and continuum radiation are usually produced as well. Molecular bands often appear as a result of molecular species in the atomizer. Molecular species can be associated or not to the element of interest. For instance, the molecular bands shown in the figure can be used to determine Ca. Continuum radiation appears as a result of thermal radiation from hot particulate matter in the atomization medium. Molecular bands and continuum radiation are a potential source of interference that must be minimized by proper choice of wavelength, by background correction, or by change in atomization conditions. Band and Continuum Spectra Associated with Atomic Spectra Molecular flame emission and flame absorption spectra for CaOH Background emission spectra from an ICP. The upper recording was taken favoring continuum and band emission while the lower recording was taken under conditions minimizing continuum and band emission.
Achilles’ heel of Atomic Spectroscopy because in many cases limits the accuracy, the precision and the limits of detection of analytical method. Primary purpose is to transfer a reproducible and representative portion of a sample into one of the atomizers presented in Table 8-1. Table 8-2 lists the common sample introduction methods for Atomic Spectroscopy and the type of samples to which each method is applicable. Atomizers “fit” into two classes: continuous and discrete atomizers. Continuous atomizers: flames and plasmas. Samples are introduced in a steady manner. Discrete Atomizers: electro-thermal atomizers. Sample introduction is discontinuous and made with a syringe or an auto-sampler. Sample Introduction Methods Continuous Discontinuous
Direct nebulization is the most common method of sample introduction with continuous atomizers. The solution is converted into a spray by the nebulizer. Types of nebulizers: Concentric tube: most common nebulizer. It consists of a concentric-tube in which the liquid sample is drawn through a capillary tube by a high-pressure stream of gas flowing around the tip of the tube. Cross-flow: the high pressure gas flows across a capillary tip at right angles. It provides independent control of gas and sample flows. Fritted disk:the sample solution is pumped onto a fritted surface through which a carrier gas flows. It provides a much finer aerosol than a and b. Babington: it consists of a hollow sphere in which a high pressure gas is pumped through a small orifice in the sphere’s surface of the sphere. It is less subject to clogging than a-c. It is useful for samples that have a high salt content or for slurries with a significant particulate content. Continuous Atomizer Nebulizers
Sample introduction in discrete atomizers is typically made manually with the aid of a syringe. The steps that convert the liquid solution into a vapor of free atoms are the same as those in continuous atomizers. The most common type of discrete atomizer is the electro-thermal atomizer. An electro-thermal atomizer is a small furnace tube heated by passing a current through it from a programmable power supply. The furnace is heated in stages. The dry and ash step removes water and organic or volatile inorganic matter, respectively. The atomization step produces a pulse of atomic vapor that is probed by the radiation beam from the hollow-cathode lamp (HCL). Discrete Atomizer Electro-thermal Vaporizers
Desolvation and Volatilization :desolvation leaves a dry aerosol of molten or solid particles. The solid or molten particle remaining after desolvation is volatilized (vaporized) to obtain free atoms. The efficiency of desolvationand volatilization depends on a number of factors: atomizer temperature, composition of analytical sample (nature and concentration of analyte, solvent and concomitants) and size distribution. In the case of nebulizers, it also depends on the nebulizer design, aerosol trajectories and resident times of the particles. Dissociation and Ionization: in the vapor phase, the analyte can exist as free atoms, molecules or ions. In localized regions of the atomizer, molecules, free atoms and ions co-exist in equilibrium. Dissociation of molecular species: molecular formation reduces the concentration of free atoms and thus degrades the detection limits. The dissociation constant for a molecular species (MX) into its components (MX <=> M + X) can be written as: Kd = nM.nX/ nMX, where n is the number density (number of species per cm3). For a diatomic molecule: logKd = 20.274 + 3/2log MMMX/MMX + log ZMZX/ZMX + 3/2(logT) – 5040Ed/T where Mi is the molecular or atomic weight of species i, Zi is the partition function of species i, Ed is the dissociation energy in eV, and T is the temperature in K. Note: The final term in this equation describes most of the temperature dependence: small values of Ed and high temperatures lead to large values of Kd and thus high degrees of dissociation. Ionization: it can also be consider an equilibrium process: M <=> M+ + e-. The ionization constant can be written as: Ki = n M+ .ne / nM, where ne is the number density of free electrons. The ionization constant can be obtained from: logKi= 15.684 + logZM+ /ZM + 3/2(logT) – 5040Eion/T where Eion is the ionization energy in eV. Note: The final term in this equation describes most of the temperature dependence: small values of Eion and high temperatures favor the formation of ions. Free-Atom Formation in Atomizers Continuous Atomizer Discrete Atomizer 107
The two most common methods of sample atomization encountered in AAS and AFS are flame and electro-thermal atomization. Flame atomization: A solution of the sample is nebulized by a flow of gaseous oxidant, mixed with a gaseous fuel and carried into the flame where atomization occurs. Oxidant (g) Carrier (g) Fuel (g) Atomic Absorption (AAS) and Atomic Fluorescence (AFS) Spectrometry (Chapter 9) • Note: • If the gas flow rate does not exceed the burning velocity, the flame propagates back into the burner, giving flashback. • The flame is stable where the flow velocity and the burning velocity are equal. • Higher flow rates than the maximum burning velocity cause the flame to blow off.
Primary combustion zone: Thermal equilibrium is not achieved in this zone and thus it is rarely used for flame spectroscopy. Inter-zonal area: Free atoms are prevalent in this area. It is the most widely used part of the flame for spectroscopy. Secondary combustion zone: products of the inner core are converted to stable molecular oxides that are then dispersed to the surroundings. Maximum temperature: it is located in the flame about 2.5cm above the primary combustion zone. Note: It is important to focus the same part of the flame on the optical beam for all calibrations and analytical measurements. Optimization: of optical beam position within the flame prior to analysis provides the best signal – to – noise ratio (S/N). It depends on element and it is critical for limits of detection. Flame Structure Increased number of Mg atoms produced by the longer exposure to the heat of the flame. Secondary combustion zone: oxidation of Mg occurs. Oxide particles do not absorb at the observation wavelength. Cr forms very stable oxides that do not absorb at this observation wavelength. Ag is not easily oxidized so a continuous increase in absorbance is observed.
Typical commercial laminar-flow burner. The aerosol formed by the flow of oxidant is mixed with fuel and passes a series of baffles that remove all but the finest solution droplets. The baffles cause most of the sample to collect in the bottom of the mixing where it drains to waste container. The aerosol, oxidant, and fuel are then burned in a slotted burner to provide a 5- to 10-cm high flame. The quiet flame and relatively long-path length minimizes noise and maximizes absorption. These features result in reproducibility and sensitivity improvements for AAS. Excitation source Detector Excitation source Flame Monochromator Detector Commercial Flame Atomizers AA Spectrometer
Commercial Electro-thermal Atomizers Cylindrical graphite tube where atomization occurs. Dimensions: about 5cm long and 1cm internal diameter. This tube is interchangeable. Cylindrical graphite electrical contacts. These contacts are held in a water-cooled metal housing. L’vov platform. Made of graphite, sample is evaporated and ashed on this platform. Temperature on the platform does not change as fast as it changes in the walls of the furnace. Atomization occurs in an environment where temperature does not change so fast, which improves reproducibility of measurements. Facilitates furnace cleaning, which reduces memory effects. Output signal Longitudinal (b) and transversal (c) furnace heating. Transversal mode is preferred because it provides a uniform temperature profile along the entire length of the tube and optical path.
Advantages of Flame Atomizers Better reproducibility of measurements RSD: Flame ≈ 1% Electro-thermal ≈ 5% - 10% Much faster analysis times than electro-thermal atomizers Wider linear dynamic ranges, up to 2 orders of magnitude wider than electro-thermal atomizers. Advantages of Electro-thermal Atomizers Smaller sample volumes (0.5mL to 10mL of sample) than flame atomizers. Better absolute limits of detection (ALOD ≈ 10-11 to 10-13 g of analyte) than flame atomizers Note:ALOD = [Sample Volume] x LOD Flame Atomizers versus Electro-thermal Atomizers Electro-thermal atomization is the method of choice when flame atomization provides inadequate limits of detection or sample availability is limited.
Glow-Discharge Atomization Cold-Vapor Atomization Hydride Atomization Hydride Atomization It provides a method for introducing samples containing arsenic (As), antimony (Sb), tin (Sn), bismuth (Bi) and lead (Pb) into the atomizer as a gas. This procedure improves limits of detection 10 to 100x. Their determination at low levels is very important because of their high toxicity. Volatile hydrides are generated by adding an acidified aqueous solution of the sample to a small volume of a 1% aqueous solution of sodium borohydride contained in a glass vessel. A typical reaction is: 3BH4-(aq) + 3H+(aq) + 4H3AsO4(aq) → 3H3BO3(aq) + 4AsH3(g) + 3H2O (l) The volatile hydride is swept into the atomization chamber by an inert gas. The chamber is usually a silica tube heated to several hundred degrees in a furnace or in a flame where atomization takes place. Specialized Atomization Techniques
Main components: (1) Radiation source (2) Sample holder = atomizer (3) Wavelength selector (4) Detector (5) Signal processor and readout Radiation source: Why not using a broadband source with a monochromator for excitation? The emission profile of the source should have a narrower effective bandwidth than the absorption line of the element of interest. HCL and electrodeless discharge lamps (EDL) satisfy this condition. Disadvantage over broadband source/monochromator: One source per element. HCL EDL Atomic Absorption Instrumentation EDL provide intensities one to two orders of magnitude better than HCL. EDL are only available for ≈ fifteen elements. Particularly useful for Se, As, Cd and Sb because it provides better LOD.
The output of the source is modulated so its intensity fluctuates at a constant frequency. The detector receives two types of signal, an alternating signal from the source and a continuous signal from the flame. A high-pass RC filter is then used to remove the continuous signal and pass the alternating signal for amplification. Source modulation can be done with a chopper or rotating disk or a power supply. High-pass filter H2 - O2 Choppers C2H2 – O2 C2H2-N2O Source Modulation Emission from the sample + emission from the flame Monochromator is able to eliminate flame interference based on wavelength separation. However, when the wavelength of interference is the same as the analyte wavelength the monochromator is unable to eliminate interference.
Single beam and double beam instruments. Double beam instruments provide the advantage of correcting for source fluctuations. In this arrangement, however, the reference beam does not pass through the flame and, therefore, it does not correct for loss of radiant power due to absorption or scattering by the flame itself. Loss of radiant power due to absorption or scattering in the flame could have different sources: (a) fuel and oxidant mixture alone (b) concomitants in sample matrix (c) all of the above When the source of loss of radiant power is only due to the fuel and the oxidant of the flame the solution is simple: make blank measurements and correct analytical data. This type of correction should be done with both types of spectrophotometers, i.e. single and double beam. Spectrophotometers for AAS
Example of spectral matrix interference due to absorption: presence of CaOH in the analysis of Barium. Solution: raise the temperature of the flame. Higher temperatures will decompose CaOH and remove its potential interference. Example of spectral interference due to scattering by products of atomization: most often encountered when particles with diameters greater than the absorption wavelength are formed in the flame: Concentrated solutions containing Ti, Zr, and W. These elements form refractory oxides. Organic species or when organic solvents are used to dissolve the sample. Incomplete combustion of the organic matter leaves carbonaceous particles. Methods for correcting spectral interference: The two-line correction method The continuum source correction method Zeeman background correction method Scattering HCL l0 F F > l0 Loss of radiant power due to absorption or scattering from concomitants in the sample matrix
It takes place when an atomic vapor is exposed to a strong magnetic field (≈10KG). It consists of a splitting of electronic energy levels, which leads to formation of several absorption lines for each electronic transition. The simplest splitting pattern is observed with singlet transitions, which leads to a central (p) line and two equally spaced (s) satellite lines (≈ 0.01nm). The central line corresponds to the original wavelength. It has an absorbance that is twice the absorbance of the satellite lines. Both s lines have the same intensity. Energy No Yes A No l A p Yes s- s+ l Zeeman Effect
The behavior of p and s lines is different with respect to plane polarized radiation: p lines absorb plane polarized radiation parallel to the external magnetic field (II). s lines absorb plane polarized radiation perpendicular (90°) to the external magnetic field. Background Correction Based on the Zeeman Effect
Ionization of atoms and molecules in atomizers can be represented by the equilibrium: M <=> M+ + e- The equilibrium constant for this reaction is: K = [M+] [e-] / [M] The ionization of a metal will be strongly influenced by the presence of other ionizable metals in the flame: B <=> B+ + e- The ionization of M will be decreased by the mass-action effect of the electrons formed from B. B can then act as an ionization suppressor. Ionization suppressors are often added to the flame to improve sensitivity of analysis. Ionization suppressors are commonly used with higher temperature flames such as N2O-acetylene. The concentration of ionization suppressor needs to be controlled to avoid primary inner filter effects, i.e. absorption of excitation radiation. Ionization Equilibria
There are five basic types of fluorescence: resonance fluorescence, direct-line fluorescence, stepwise-line fluorescence, sensitized fluorescence and multi-photon fluorescence. The figure shows an energetic diagram level for resonance fluorescence. In all cases, the basic instrumentation is the same. EDL are the best excitation sources for AFS. The advantage of AFS over AAS is that it provides better limits of detection for several elements. Energy Atomic Fluorescence Spectroscopy (AFS)
The figure shows the typical configuration of a flame or plasma emission spectrometer. There are three primary types of high temperature plasmas: ICP = inductively coupled plasma DCP = direct current plasma MIP = microwave induced plasma ICP and DCP are commercially available. Both types of plasmas sustain temperatures as high as 10,000K. Atomic Emission Spectrometry (Chapter 10) • ICP: • It consists of three concentric quartz tubes through which streams of argon flows. The diameter of the largest tube is 2.5cm. • Surrounding the top of the largest tube is a water-cooled induction coil that is powered by a radio-frequency generator, which radiates 0.5 to 20KW of power at 27.12MHz or 40.68MHz. This coil produces a fluctuating magnetic field (H). • Ionization of the flowing argon is initiated by a spark from a Tesla coil. The interaction of the resulting ions, and their associated electrons, with H makes the charges to flow in closed annular paths. • The resistance of ions and electrons towards the flow of charges causes ohmic heating of the plasma. • The tangential flow of argon cools the internal walls of the ICP. • Spectral observations are generally maed at a height of 15 to 20mm above the induction coil, where the temperature is 6,000-6,500K and the region is “optically transparent” (low background).
DCP It consists of three electrodes configured in an inverted Y. A graphite anode is located at each arm of the Y and a tungsten cathode at the inverted base. Argon flows from the two anode blocks toward the cathode. The plasma is formed by bringing the cathode into momentary contact with the anodes. Ionization of the argon occurs an a current develops that generates additional ions to sustain the current indefinitely. The temperature at the arc core is between 5,000K and 8,000K. ICP versus DCP: DCP present lower background than ICP. ICP is more sensitive than DCP; LOD in ICP are approximately one order of magnitude better. DCP and ICP have similar reproducibility of measurements. DCP requires less argon usage. ICP is easier to align because the optical window of a DCP is relatively small. Graphite electrodes must be replaced every few hours, whereas the ICP requires little maintenance.
The main two types of instruments for AES fit into two general categories: sequential or multi-channel spectrometers. Sequential instruments are designed to read one line per element at the time. Multi-channel instruments are designed to measure simultaneously the intensities of emission lines for a large number of elements (50 or 60 elements). Both instruments require wavelength selectors with high spectral resolution. Sequential instrumentation: It uses a slew-scanning monochromator. Hg lamp is used for calibration. Two PMT, one is used for the UV and the other for the VIS. A flipping mirror selects the exit slit and the PMT. Instrumentation
Scanning Echelle instrumentation It can be used either as a single channel or as a “simultaneous multi-channel spectrometer”. Scanning is accomplished by moving the PMT in both x and y directions to scan an aperture plate located on the focal plane of the monochromator. The plate contains as many as 300 slits. The time it takes to move the PMT from one slit to another is approximately 1s. This arrangement can be converted to a multi-channel system by placing small PMT behind several exit slits. Polychromators The entrance slit, the exit slits, and the grating surface are located along the circumference of a Rowland circle. The curvature of a Rowland circle corresponds to the focal plane of a monochromator. Each exit slit is factory configured to transmit lines for selected elements. The entrance slit can be moved tangentially to the Rowland circle to provide scanning.
Charge-Coupled Device Instrumentation Typically incorporate two CCD, one for the UV (165nm – 375nm) and one for the VIS (375nm – 782nm). The Schmidt cross-disperser separates the UV from the VIS radiation and the orders at each emission wavelength. Elements Determined Tl and Nb curves are not linear probably because of incorrect background subtraction. Self-absorption is another cause of non-linearity. It occurs at high concentrations where the non-excited atoms absorb emitted radiation.