Download
1 / 12
140 likes | 282 Views
Linear Inequalities in Two Variables. AII, 2.0: Students solve systems of linear equations and inequalities (in two or three variables) by substitution, with graphs, or with matrices. Linear Inequalities in Two Variables. Objectives. Key Words. Linear inequality in two variables

E N D
Linear Inequalities in Two Variables AII, 2.0: Students solve systems of linear equations and inequalities (in two or three variables) by substitution, with graphs, or with matrices.
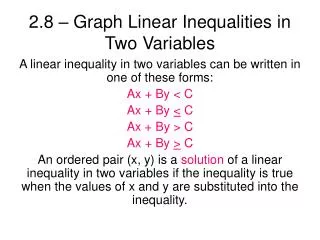
Linear Inequalities in Two Variables Objectives Key Words Linear inequality in two variables Boundary Line Dashed Shaded Half-Plane Test a point • Solve and graph linear inequalities in one variables • Solve and graph linear inequalities in two variables
Pre-requisite Check Name the Symbol Check Solutions of Inequalities Check whether the given ordered pair is a solution of . True or False. • < • > • ≤ • ≥
Graph linear inequalities in one or two variables • GRAPH the boundary line of the inequality. Use a dashed line for < or >. Use a solid line for ≤ or ≥. • TEST a point that is not on the boundary line to see whether it is a solution of the inequality. Then shade the appropriate half-plane Steps for graphing a linear inequality.
Example 1 y = < < – – y y 2. 2 SOLUTION – 2. a. Graph the boundary line Use a dashed line because 3 x ≤ Test the point (0, 0). It is not a solution, so shade the half-plane that does not contain (0, 0). Graph Linear Inequalities in One Variable Graph (a) and (b) in a coordinate plane.
Example 1 Test the point (0, 0). It is a solution, so shade the half-plane that contains (0, 0). 3. x ≤ x = 3. Graph Linear Inequalities in One Variable b. Graph the boundary line Use a solid line because
Checkpoint x ANSWER – 1 > 2. y 1 ANSWER ≥ Graph Linear Inequalities in One Variable Graph the inequality in a coordinate plane. 1.
Checkpoint ANSWER – 3 4. ANSWER < x 4 y ≤ Graph Linear Inequalities in One Variable Graph the inequality in a coordinate plane. 3.
Example 2 < < y y 2x 2x. 8 3x 2y ≥ – SOLUTION y = 2x. a. Graph the boundary line Use a dashed line because Graph Linear Inequalities in Two Variables Graph (a) and (b) in a coordinate plane. Test the point (1, 1). Because (1, 1)is a solution, shade the half-plane that contains (1, 1).
Example 2 b. Graph the boundary line . Use a solid line because 8. 3x 2y ≥ – Test the point . Because is not a solution, shade the half-plane that does not contain . ( ( ( ) ) ) 0, 0 0, 0 0, 0 8 3x 2y = – Graph Linear Inequalities in Two Variables
Checkpoint y x ≥ ANSWER 6. ANSWER x – 3y 1 > Graph Linear Inequalities in Two Variables Graph the inequality in a coordinate plane. 5.
Conclusions Summary Assignment If not completed in class, it will be due the following day we meet. Pg 182 (18, 26, 36, 44, 47) • What does a dashed boundary line on the graph of an inequality represent? • A dashed boundary line means that the points on that line are not solutions of the inequality.