Download
1 / 48
480 likes | 613 Views
Tuberculosis Control in Australia in the 21 st Century. Dr F T S Chiu OAM, MBBS, FRACP, FCCP, JP. Department of Thoracic Medicine Royal Adelaide Hospital, South Australia, SA 5000 Australia. M.Tuberculosis- Active Disease Rate in SA, 1905-1998. 160. Rate of Decline. 140.

E N D
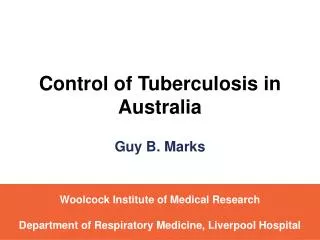
Tuberculosis Control in Australia in the 21st Century Dr F T S ChiuOAM,MBBS, FRACP, FCCP, JP Department of Thoracic MedicineRoyal Adelaide Hospital, South Australia, SA 5000 Australia
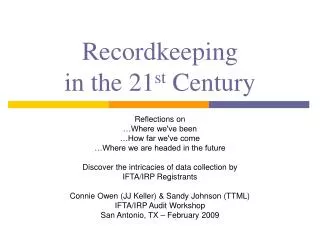
M.Tuberculosis- Active Disease Rate in SA, 1905-1998 160 Rate of Decline 140 *Pre 1980 includes atypicals 120 100 Introduction of Anti-TB Drugs 2.8% 80 Rate/100,000 60 10% 40 7% 20 0 1905 1919 1932 1945 1958 1971 1984 1998
Current International Situation Europe 33.3 America 34.9 Western Pacific 55.5 EastMediterranean 55.2 South East Asia 94.4 Africa 96.8 Global Emergency WHO 1/3 infected (1900 million) 8 million new cases/year 3 million death/year TB leading cause of death Global 60% (1994) Rates (per 100,000) Taux (pour 100,000) Australia 5.47 > 100 25 to 100 – 25 å 100 < 25 No report – Pas de notification
Global TB Situation Most significant public health threat • TB infects 2 billion people • “A global Health Emergency”- WHO 1993 • Complicated by • HIV/AIDS • MDRTB • 2001 WHO Global Surveillance Program • 183 countries notified 3.8 million TB cases, 42% sputum smear + ve • Underestimated • Global TB incidence increased 0.4% p.a • esp. .Sub-Saharan Africa .Countries of former Soviet Union • Western Pacific Region (WPR) • 24% of notified cases • 4/22 countries high TB burden
Global TB Situation (continue) Australia • One of the lowest incidence rates of TB • Two sub-populations have high incidence rates of TB: • - Indigenous Australians • - People born overseas • National TB Advisory Committee (NTAC) • - Implemented a National Strategic Plan for TB control in Australia beyond 2000 (Endorsed by Communicable Diseases Net Work Australia. CDNA 2002). • TB Notification • - National Mycobacteria Surveillance System (past) • - Enhanced surveillance for TB Notification : Commenced 2001 as part of National Notifiable Diseases Surveillance System
7 6 5 4 3 2 1 0 Incidence Rates per 100,000 population for tuberculosis notifications, Australia 1948 to 2002 60 50 Rate per 100,000 population 40 30 Rate per 100,000 population 1996 1997 1998 1999 2000 2001 2002 20 Year 10 0 1952 1957 1962 1967 1972 1977 1982 1987 1992 1997 2002 Year
Notifications of new and relapsed cases of tuberculosis and rates per 100,000 population, Australia, 2002, by State and Territory* StateNew New casesRelapse Relapse caseTotalTotalcases ratecases raterate Australian 14 4.3 0 0 14 4.3CapitalTerritory New South Wales 441 6.6 6 0.1 447 6.7 Northern Territory 37 18.7 1 0.5 38 19.2 Queensland 124 3.3 9 0.2 133 3.6 South Australia 43 2.8 3 0.2 46 3 Tasmania 9 1.9 0 0 9 1.9 Victoria 272 5.6 7 0.1 279 5.7 Western Australia 57 3 4 0.2 61 3.2 Australia 997 5.1 30 0.2 1027 5.2 * There was one case where relapse status was unknown
35 30 25 20 15 10 5 0 ACT NT QLD SA TAS VIC WA AUS NSW Notification Rates for tuberculosis, Australia, 2000 to 2002, by State and Territory 2000 2001 2002 Rate per 100,000 population State/Territory
TB Notification Rates, 2002 Timor Sea Coral Sea Indian Ocean 19.2 3.6 3.2 3 6.7 4.3 Australia - 5.2Red indicates aboveNational average 5.7 Tasman Sea 1.9
Notifications of tuberculosis and incidence Rates in Indigenous and non- Indigenous people born in Australia, 2002, by State and Territory Site/TerritoryIndigenousRateNon-Indigenous RateTotal RateAustralia bornAustralia born Australia born Australian 0 0.0 1 0.4 1 0.4CapitalTerritory New South Wales 2 1.6 60 1.2 62 1.2 Northern Territory 24 41.9 2 1.8 26 14.0 Queensland 9 7.4 34 1.1 43 1.4 South Australia 1 4.0 10 0.8 11 0.9 Tasmania 0 0.0 5 1.2 5 1.2 Victoria 1 4.0 47 1.2 48 1.3 Western Australia 0 0.0 8 0.6 8 0.6 Australia 37 8.5 167 1.1 204 1.3
Trends of tuberculosis incidence rates, Australia, 1991 to 2002, by Indigenous status and country of birth Overseas-born person Indigenous Australians 25 Non-indigenous Australians 20 15 Rate per 100,000 population 10 5 0 1991 1992 1993 1994 1995 1996 1997 1998 1999 2000 2001 2002 Year
Notification of Tuberculosis and estimated rate per 100,000 population for selected countries of birth, Australia, 2002 CountryNewRelapsed TotalEstimated AustraliaRate per 100,000WHO incidenceof Birth Cases CasesCasesResident Populationpopulation in rate (per 100,000by country of Birth, Australia by Country population for2001 of Birth, 2002* country, 2001# India 106 0 106 95455 111.0 43 Vietnam 98 4 102 154833 65.9 115 Philippines 91 1 92 103942 88.5 139 China** 54 1 55 142778 38.5 38 Indonesia 48 0 48 47156 101.8 134 Papua 21 3 24 23618 101.6 323New Guinea Somalia 22 1 23 3713 619.4 75 Thailan 22 0 22 23599 93.2 78 HongKong 19 1 20 67121 29.8 109
Notification of Tuberculosis and estimated rate per 100,000 population for selected countries of birth, Australia, 2002 CountryNewRelapsedTotalEstimated AustraliaRate per 100,000WHO incidenceof Birth Cases CasesCasesResident Populationpopulation in rate (per 100,000by country of Birth, Australia by Country population for2001 of Birth, 2002* country, 2001# Korea*** 16 1 17 38958 43.6 79~ Malaysia 15 0 15 78858 19.0 66 United 14 0 14 1083318 1.3 10Kingdom Cambodia 13 0 13 22979 56.6 143 Sri Lanka 12 0 12 53460 22.4 39 Other 247 9 259 2148140 Overseas 798 21 819 4087928 19.9 Australia 197 7 204 15619272 1.3 Not Stated 2 2 4 Total 997 30 1027 19707200 5.2
Notifications and Estimated Incidence Rate of Tuberculosis per 100,000 Population, Australia, 2002, by Age Group, Indigenous Status and Country of Birth AgeIndigenousIndigenousNon-Indigenous Non-Indigenous OverseasOverseasGroupAustralia born Australia born Australia born Australia born -born-born NUMBERRATENUMBERRATENUMBERRATE 0 - 4 3 5.7 12 1 4 15.9 5 - 14 4 3.7 7 0.3 10 5.6 Sub total 7 4.3 19 0.5 14 6.9for<15 years 15 - 24 2 2.7 15 0.7 109 27.7 25 - 34 6 9.4 15 0.7 191 31.6 35 - 44 9 17.8 17 0.8 148 17.1 45 - 54 3 9.3 16 0.9 120 13.7 55 - 64 7 43.4 18 1.5 69 9.9 65+ 3 26.2 67 4.1 159 18. AUTRALIA 37 9 167 1.1 810 18.1
Incidence rate of Tuberculosis in Australian-born and Overseas-born people, 2002, by Age Group and Sex Male Australia-born 40 Male Overseas-born 35 Female Overseas-born Female Australian-born 30 25 Rate per 100,000 population 20 15 10 5 0 0 - 4 5 - 14 15 - 24 25 - 34 35 -44 45 - 54 55 - 64 65+ Age Group (Years)
TB and Selected Risk Factors 2002 • 220/1028 (21.4%) cases reported • 139 household members or close contacts • 9 Correctional Services • 17 Aged Care Facilities • Individuals Working in High Risk Settings • 3 Correctional Facilities or Aged Care Facilities • 10 Health Industries • 140 resided >3 months in High Risk Countries
TB & HIV Status 2002 • 281/1028 (27.3%) TB case notified reported HIV Status • 11 HIV positive • 2 born in Australia • 9 born overseas 2001 • 4.2% TB case notified reported HIV status
New and relapsed cases in Australia, 2002, by site of disease SiteNew casesRelapse casesTotal cases% of cases Pulmonary 585 17 602 58.7 Lymphatic 160 5 165 16.1 Pleural 93 4 97 9.5 Bone/Joint 51 1 52 5.1 Meningeal 21 0 21 2.0 Genitourinary 19 1 20 2.0 Miliary 11 0 11 1.1 Peritoneal 7 0 7 0.7 Other 23 0 23 2.2
Antimicrobial Therapy 2002 • Antimicrobial drug regime reported for 930 (90.5%) TB cases • 23 cases 2D • 101 cases 3D • 804 cases 4D (99.69%, INH, RIF, PYZ, ETM) • 2 cases >5D • Under 8 years • 13 cases 3D (INH, RIF, PYZ)
Outcome of Treatment for Tuberculosis amongst cases evaluated, Australia, 2002, by Australian-born (Indigenous and Non-indigenous) and Overseas-born individuals Treatment IndigenousNon-Indigenous OverseasUnknownTotal PercentOutcomeAustralia Australia bornof Casesborn born Cured (Bacteriological 19 11 43 1 74 9.2%confirmed) Completed Treatment 9 87 482 0 578 72.1% Interrupted Treatment 0 1 2 0 3 0.4% Died of TB 2 5 10 1 18 2.2% Died of Other Cause 2 20 40 2 64 8.0% Defaulted* 0 2 4 0 6 0.7% Failed** 0 0 1 0 1 0.1% Transferred out of 1 2 53 2 58 7.2%Australia Total 33 128 635 6 802
National Tuberculosis performance indicators, performance criteria and the current status of Tuberculosis in Australia, 2002 National TB Performance Indicator Performance2001 2002CriteriaAnnual Incidence of TB (per 100,000 population) % %Crude IncidenceIndigenous Australians <1 9.8 8.5Non-indigenous Australian-born <1 1 1.1Overseas-born persons* ** 10.2 11.5 <2% of total NA NARelapse cases initially treated in Australiatreated cases Incidence in children <15 years, by risk group Indigenous Australian Children <0.1 2.4 4.3Non-indigenous Australian-born Children <0.1 0.5 0.5Overseas-born Children* ** 1 0.1Collection of HIV status in TB case 100% over (% of cases with data collected) next 3 years 4.2 27.3Treatment outcome measures(%) Cases evaluated for outcome# 100 76.9 78*** Cases that have treatment completed and are cured >90 83.6 80 Cases recorded as treatment failures# <2 0.9 0.1
Communities at Risk for Tuberculosis Unemployed Health Care Workers No access to care Elderly Malnutrition HIV/AIDS Poverty Tuberculosis Drug Abusers Minorities Incarcerated Indigenous Australian(Aboriginal & Torres Strait Island People) Homeless Immigrants Uneducated
TB Notifications in South Australia 1990-2000 Pulmonary Extra-Pulmonary Linear (Pulmonary) Linear (Extra-Pulmonary) 80 70 60 50 Number of cases 40 30 20 10 0 1990 1991 1992 1993 1994 1995 1996 1997 1998 1999 2000 Year
Extra-Pulmonary Tuberculosis 1990-2000 43% Lymph Node Pleura 18% Genito/urinary 11% Bone/Joint 10% Other 6% Site of Disease Miliary 5% Meningeal 3% Skin 2% Peritoneal 1% GIT 1% 0 10 20 30 40 50 60 70 80 Number of Cases
M.tuberculosis Notification Rates Compared with Abnormal TST Rates 60 Active Disease 50 Abnormal TST 40 Rate per 100,000 30 20 10 0 1945 1960 1975 1990 SA 2.3/100,000 Aust 5.47/100,000 Year
Current Situation • Australia has one of the lowest incidences of TB in the Western Pacific Region 2002 • 5.2/100,000 (5 to 6/100,000 since mid -1980) • Sub-population • Indigenous Australians • 8.5/100,000 (2/3 in Northern Territory, 28% of overall population c/w 2% national wide) • Those born overseas • 20.2/100,000 • Highest rates of TB in 15–34 years old • 34.5% of all TB notified in people born in India, Vietnam, Philippines, Indonesia & China.
Global Partnership • To foster global partnerships • RAH– Bali TB project in partnership with Bali Department of Health • Australia Red Cross • $400,000 grant over six years • training in treatment and laboratory services based on WHO “DOT” strategy • IMVS • Indonesian - Australian Specialized Training Project for laboratory diagnosis of TB, quality assurance and TB community development • Train the trainer approaches • SA at forefront of regional TB control
Footnote on Chinese Community in Australia • Chinese population in Australia relatively small (? Official censors) • Chinese have overcome racial prejudice and blended into the Australian Community • National Centenary Celebration of Federation of Australia • held in Melbourne 2001 • Chinese also held national conference at the same time • Chinese widely respected and enjoy proportional previleges • Many Chinese Organizations • Medical eg ACMA, ACCMA • Other organizations, culture clubs, Chambes of Commerce, welfare associations etc • Federation • In SA, Forum of Chinese organizations in SA 1996 • Federation of Chinese organizations in SA (FOCOSA) 2001 • Chinese Community in Australia • A cohesive and fairly united group • Future fairly bright