Download
1 / 9
90 likes | 207 Views
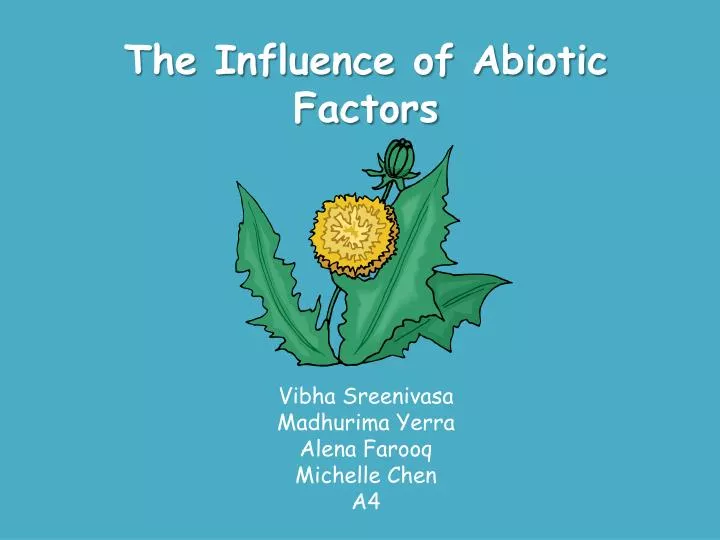
The Influence of Abiotic Factors. Vibha Sreenivasa Madhurima Yerra Alena Farooq Michelle Chen A4. Our Research Question . How does the distance from the corner of the sidewalk affect the population density of the weed that grows there?. Our Hypothesis.

E N D
The Influence of Abiotic Factors Vibha Sreenivasa Madhurima Yerra Alena Farooq Michelle Chen A4
Our Research Question • How does the distance from the corner of the sidewalk affect the population density of the weed that grows there?
Our Hypothesis • We hypothesize that the farther from the corner of the sidewalk you measure, the larger the population density of the weeds, because people are more likely to trample on the area closer to the corner of the sidewalk, which does not allow the weed to grow.
Design of our experiment Independent Variable - Distance from the corner of the sidewalk Measure of Independent Variable -Starting at the corner of the sidewalk (0 ft), we measured using 1 foot increments and stopped at 10 feet. Dependent Variable - Population density of the weed Measurement of Dependent Variable- Before taking our samples, we measured 1 foot on either side of our line of measure. Along that line, we took 5 different, 3 inches by 3 inches, or 9 square inches, sized samples. Then, we took the average of the samples. Constants- 1. Type of weed 2. Number and size of the samples 3. Location of the experiment (section of grass/weeds in front of the school, along the pick-up circle) 4. Amount of sunlight
Our Conclusion • In the end, we are able to conclude that our hypothesis was proved to be correct due to our findings from this experiment. As the distance from the corner of the sidewalk increased, so did the population density of the weeds. Although this change was slow to occur and stuttered in one location, overall the growth was evident. We also correctly stated the reason for this. Considering that people do not walk selectively on the sidewalk, it is hard for any kind of plant to grow when it is constantly stepped upon. • This is exactly what we would see in an actual population. Any organism that is constantly trampled will not have the strength to keep growing, or even start to grow. It damages them, and in that damaged state they need to produce more to repair themself. • Next time, if we were to do this again, we would probably use a better tool of measurement. Even though our tool of measurement worked just fine, it was not the most efficient method. Other than that, we had no other problems with our experiment.