Download
1 / 6
60 likes | 208 Views
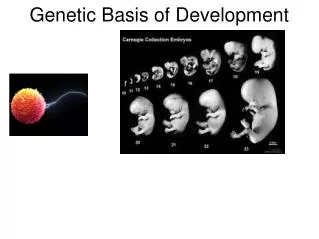
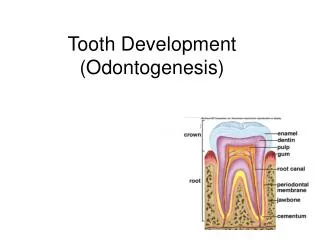
Genetic Interactions in Tooth Development. Stages of tooth development. .Initiation stage/Thickening .Bud stage .Cap stage .Bell stage. Molar Tooth Development.

E N D
Stages of tooth development • .Initiation stage/Thickening • .Bud stage • .Cap stage • .Bell stage
Molar Tooth Development • Figure 1. Schematic representation of molar tooth development. Genes essential for tooth development are indicated at the developmental stage at which tooth • development arrests in mutant mice. They are highlighted in yellow, blue or red, depending on their requirement, respectively, in the epithelium, mesenchyme or • enamel knot. Red arrows represent the reciprocal signalling between epithelium and mesenchyme during advancing tooth development. At the bell stage, the two • rows of developing ameloblasts and odontoblasts are respectively indicated as bright yellow and dark blue lines at the epitheliomesenchymal surface. Am, ameloblasts, • Cm, condensed mesenchyme, Dp, dental papilla; Ek, enamel knot; Ep, epithelium; Mes, mesenchyme, Od, odontoblasts; Sek, secondary enamel knot.
Salazar-Ciudad and Jernvall PNAS June 11, 2002 vol. 99 no. 12 8117 • Fig. 1. Basic principles of the modeling approach and the morphodynamic • model on tooth development. (A) The starting point of the model is an • empirically derived simplified gene network based on both experimental and • spatiotemporal gene expression data (putative gene groupings from teeth • only, molecular effects are often context-dependent). (B) The final gene • network after further simplification based on simulations and analyses. (C) To • examine whether a gene network is sufficient in approximating tooth-shape • development, the model produces three-dimensional shapes and distributions • of activator and inhibitor concentrations peaks. (D) The simulated shapes • are analyzed by comparing them to empirical data on developing tooth • shapes. The simulations depict growth of the inner enamel epithelium above • the dental mesenchyme separated by the basement membrane (white line in • D). In actual teeth, the cells of the inner enamel epithelium differentiate into • enamel-forming ameloblasts and the mesenchymal cells below differentiate • into dentine-forming odontoblasts. In an erupting tooth the mesenchyme • (papilla) forms the tooth pulp whereas the inner enamel epithelium and the • overlying epithelial stellate reticulum are degraded, exposing enamel surface. • The first cusp forms when epithelial cells differentiate into nondividing • enamel knot cells (EK, Fgf4 expression in black in D). This change happens in • the model when activator ‘‘A’’ concentration reaches a set threshold. Knot • cells secrete inhibitor ‘‘I’’, which counteracts the secretion of activator, thus • also inhibiting the formation of the second cusp immediately adjacent to the • first cusp (C Lower). In addition, unlike in classic reaction-diffusion models, • activator and inhibitor modulate tissue growth, making developing shape • itself have a causal role in the placement ofnewknots. For example, formation • of the second cusp also depends on the relative sharpness of cusps, because • sharpness modifies the volume of mesenchymal tissue into which molecules
4. Major transitions in mammalian molar evolution require small • changes in the model parameters. The top pair show modeled triconodont • and pretribosphenic shapes of lower molar. The pretribosphenic has been • derived from the triconodont shape by adjusting parameters Re and Bl. The • bottom pair shows the modeled evolution of the hypocone (as the fourth cusp • in the quadritubercular tooth) on the tribosphenic upper molars. The hypocone • has evolved at least 20 times among mammalian lineages, and at least • two different parameter changes (k2 109 or Bl 0.000757) can independently • produce the hypocone in the model. The parameter values for the • illustrated triconodont tooth are k1 1.5; k2 110; k3 0.001; DA 0.3; DI • 0.4; Re0.00095; Rm0.000465; Ba0.00045; Bp0.0007; Bl0.00015; Bb • 0.0001, and the same for the pretribosphenic tooth except for Re 0.00090 • and Bl 0.00056. The tribosphenic parameters are k1 1.5; k2 110; k3 • 0.001; DA 0.3; DI 0.4; Re 0.0005722; Rm 0.000465; Ba 0.00024; Bp • 0.000955; Bl0.000756; Bb0.000442, and the same for the quadritubercular • tooth except for k2 109. Obliquely lingual views; anterior side is toward t
Shh signals • Fig. 7. Shh signalling along the dental axis during initiation of • odontogenesis. (A) In the presence of epithelium, Shh transcription is • limited to the incisor and molar-forming epithelium, and is • established by autoregulation (dashed line). Shh protein diffuses • from epithelium into mesenchyme, where it induces both Ptc1 and • Hhip1. Ptc1 and Hhip1 protein restrict Shh signalling to the sites of • incisor and molar odontogenesis, but some Shh protein is able to • diffuse into the diastema mesenchyme. In the presence of diastema • epithelium, Gas1 sequesters and masks the activity of Shh protein in • the diastema mesenchyme, thus maintaining restriction of Shh • signalling to odontogenic regions. Ptc1 and Hhip1 transcription has • not been shown in the tooth germs for simplicity. (B) In the absence • of epithelium, Gas1 is lost in diastema mesenchyme, leaving • localised Shh signalling in this region, which activates transcription