Download
1 / 32
320 likes | 326 Views
REGIONAL SNAPSHOT. Northwest South Dakota Region, South Dakota. 01. 02. 03. 04. 05. Overview. Demography. Human capital. Labor force. Industry and occupation. Table of contents. 01 overview. Northwest South Dakota Region, SD What is a regional snapshot?.

E N D
REGIONAL SNAPSHOT Northwest South Dakota Region, South Dakota
01 02 03 04 05 Overview Demography Human capital Labor force Industry and occupation Table of contents
01 • overview Northwest South Dakota Region, SD What is a regional snapshot?
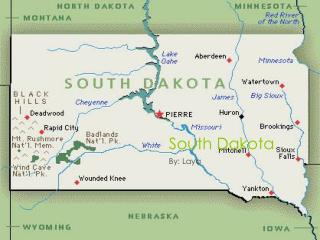
Northwest South Dakota Region Overview • The Northwest South Dakota Region is comprised of three South Dakota counties. I-90 passes through the southwestern edge of the region and state highway 12 passes through the northern edge of the region connecting to I-94 to the west. • Corson • Meade • Perkins section 01
What is a regional snapshot? Overview What is the snapshot? This snapshot is a demographic and economic assessment of the Northwest South Dakota Region in South Dakota. Using county-level data, PCRD analyzed a number of indicators to gauge the overall economic performance of the Northwest South Dakota Region in comparison to the rest of the state. What is its purpose? The snapshot is intended to inform the region’s leaders, organizations and residents of the key attributes of the region’s population and economy. In particular, it takes stock of the region’s important assets and challenges. With such data in hand, regional leaders and organizations are in a better position to invest in the mix of strategies that will spur the growth of the economy and provide a higher quality of life for residents of the region. • What are its focus areas? • PCRD secured and analyzed recent data from both public and private sources to generate the snapshot. In order to build a more comprehensive picture of the region, the report presents information under four key categories. • Demography • Human Capital • Labor Force • Industry & Occupation • When appropriate or relevant, the report compares information on the region with data on the remainder of the state. By so doing, the region is better able to determine how well it is performing relative to the state on a variety of important metrics. section 01
02 • demography • Population change • Age structure • Income and poverty
4.4% Total population projections Population change 4.8% 855,391 8.1% 819,009 Northwest SD Region Demography 781,714 -0.3% 5.2% 723,047 2.1% Rest of South Dakota 34,056 34,166 32,466 31,797 2014-2020 2000-2010 2010-2014 2000 • Questions: • How does the region’s population trend compare to that of the state? • What may be some of the elements driving the trends in the region? In the state? • What strengths or challenges might these trends present? section 02 • Source: 2000 & 2010 Census, 2014 Population Estimates, and 2020 Population Projection by South Dakota State University's Census Data Center, South Dakota, http://dlr.sd.gov/lmic/menu_demographics.aspx
Demography 3.8% Ethnicity Race 2000 Hispanics - 2000 Hispanics - 2014 2014 section 02 • Race Data Source: U.S. Census Bureau – 2000 Decennial Census and 2014 Annual Population Estimates
Demography Population Age Structure, 2000 A visual presentation of the age distribution of the population(in percent) section 02 • Source: 2000 Decennial Census, U.S. Census Bureau
Demography Population Age Structure, 2014 A visual presentation of the age distribution of the population(in percent) • Questions: • Is the region experiencing an aging of its population? How does this compare to the rest of the state? • Is there a sizable number of people of prime working age (20-49 years of age) in the region? • Is the youth population (under 20 years old) growing or declining? • What are the implications of the region’s age structure for the economic development efforts of the region? section 02 • Source: 2014 Population Estimates, U.S. Census Bureau
Demography Income and poverty Questions: • Is the poverty rate for individuals in the county getting better or worse? • Is poverty for minors in the county lower or higher than the overall poverty rate for all individuals? Why? • Has real median income (adjusted for inflation) improved or worsened over the 2003 to 2013 time period? What may be reasons for these changes? section 02 * Note: Regional Median Household income is the population-weighted average of median household income values across the Northwest SD Region counties. Source: U.S. Census Bureau – Small Area Income and Poverty Estimates (SAIPE)
03 • human capital • Educational attainment • Patents
Educational attainment, 2013 Human capital Northwest SD Region Rest of South Dakota • Questions: • What proportion of the adult population in the region has only a high school education? • How many are college graduates (bachelors degree or higher)? • How does the educational profile of the region compare to that of the rest of the state? • What are the implications of the educational profile of the region in terms of the region’s economic opportunities or workforce challenges? Some high school No high school Associate’s degree Bachelor’s degree Graduate degree High school diploma Some college section 03 • Source: 2009-2013 American Community Survey 5-Year Estimates
Patents Human capital Patents per 10,000 Jobs 2001-2013 From 2001 to 2013, Northwest SD Region counties were issued patents at a rate of 0.67 per 10,000 jobs, while the remaining South Dakota counties garnered 1.49 patents per 10,000 jobs. • Patenting trends are an important indicator of the level of innovation in a region. • Commercializing this innovation can lead to long-term growth for regional economies. • Questions: • How does the region’s patent rate compare to that of the rest of the state? • How have rates changed over time? • What might this data suggest for the future of the region? Patents per 10,000 residents 2001-2013 From 2001 to 2013, 0.45 patents per 10,000 residents were issued in Northwest SD Region counties. The rest of South Dakota amassed 1.02 patents per 10,000 residents. section 03 • Source: U.S. Patent and Trademark Office, Census, BEA, and EMSI • *Note: Patent origin is determined by the residence of the first-named inventor. Since a number of workers commute into the region, the number of patents produced in the IN 15RPC Region could be high. However, among residents of the region, patent production is relatively low.
04 • labor force • Unemployment rates • Earnings per worker • Source of labor for the region
Labor force Unemployment rates • Questions: • How does the region’s unemployment rate compare to the rest of the state and nation? • How does the region’s unemployment peak and post-2009 recovery compare to the state and nation? • What might this suggest for the region’s economic future? US Total Northwest SD Rest of State section 04 • Source: LAUS, BLS
Labor force Earnings per worker in 2014 • Questions: • How does the region’s average earnings compare to that of the rest of the state? • What might be some driving factors for the differences? • Do these represent potential strengths or challenges for the region? • NOTE: Earnings include wages, salaries, supplements and earnings from partnerships and proprietorships Northwest SD Region Rest of State Average earnings section 04 • Source: EMSI Class of Worker 2014.4 (QCEW, non-QCEW, self-employed and extended proprietors)
Journey to Work Labor force Out-Commuters Same Work/ Home In-Commuters 9,016 4,601 3,752 • Questions: • How many people employed in the region actually reside outside the region? How many who live in the region commute to jobs outside the region? • What are the implications for the region’s economic development efforts? section 04 • Source: LEHD, OTM, U.S. Census Bureau
05 • industry • and occupation • Establishments • Employment by industry • Cluster analysis • Top occupations • STEM occupations
Industry and occupation Establishments • An establishment is a physical business location. • Branches, standalones • and headquarters are all considered types of establishments. Definition of Company Stages 0 1 Self-employed 2-9 employees • 3 10-99 employees 100-499 employees 4 500+ employees section 05 • Source: National Establishment Time Series (NETS) – 2011 Database
Industry and occupation Establishments • Questions: • What stage businesses have shaped the region’s economic growth in the last 10 years? • Which ones are growing or declining the most? • Which stage of establishments are likely to shape the region’s future economic growth? section 05 • Source: National Establishment Time Series (NETS) – 2011 Database
Industry and occupation Establishments • Questions: • What establishments are the most numerous based on company stages? • What stages have experienced the largest growth? The greatest decline? • What company stage employs the largest number of people? • What stage captures the most sales? • Which ones have experienced the greatest percentage loss over the 2000-11 period? Note: In 2000, Stage 4 establishments included the air force base and the veteran affairs office and no sales was reported. In 2011, the school board became a Stage 4 establishment. section 05 • Source: National Establishment Time Series (NETS) – 2011 Database
Industry and occupation Top ten industry sector employment growth • Questions: • What regional industry sectors have seen the greatest growth? • Did they grow at the same rate as the state? • What factors are causing the growth? section 05 • Source: EMSI Class of Worker 2014.4 (QCEW, non-QCEW, self-employed and extended proprietors)
Industry and occupation Top seven industry sector employment decline • Questions: • How does the industry sector make-up of the region compare to the rest of the state? • Which industry sectors are growing and declining the most in employment? section 05 • Source: EMSI Class of Worker 2014.4 (QCEW, non-QCEW, self-employed and extended proprietors)
Industry cluster analysis How to interpret cluster data resultsThe graph’s four quadrants tell a different story for each cluster. Contains clusters that are more concentrated in the region and are growing. These clusters are strengths that help a region stand out from the competition. Small, high-growth clusters can be expected to become more dominant over time. Contains clusters that are more concentrated in the region but are declining (negative growth). These clusters typically fall into the lower quadrant as job losses cause a decline in concentration. Mature Top left (strong but declining) Stars Top right (strong and advancing) Emerging Bottom right (weak but advancing) Transforming Bottom left (weak and declining) Contains clusters that are under-represented in the region (low concentration) and are also losing jobs. Clusters in this region may indicate a gap in the workforce pipeline if local industries anticipate a future need. In general, clusters in this quadrant show a lack of competitiveness. Contains clusters that are under-represented in the region but are growing, often quickly. If growth trends continue, these clusters will eventually move into the top right quadrant. Clusters in this quadrant are considered emerging strengths for the region. section 05 • Modified from: http://www.charlestonregionaldata.com/bubble-chart-explanation/
Distribution of clusters in the Region by quadrants Industry and occupation section 05
Industry cluster analysis Level of Specialization Percent Growth in Specialization section 05 NOTE: The first number after each cluster represents its location quotient while the second number represents the number of total jobs (full and part time jobs by place of work) in that cluster in the region in 2014. The clusters are sorted in decreasing order by location quotient.
Regional requirements, 2013 Industry Clusters: Leakages Note: ** shows Star clusters section 05 • Source: EMSI 2014.4 (QCEW Employees, Non-QCEW Employees, Self-Employed, and Extended Proprietors); Industry cluster definitions by PCRD
Top five occupations in 2014 Industry and occupation • Questions: • What are the education and skill requirements for these occupations? • Do the emerging and star clusters align with the top occupations? • What type salaries do these occupations typically provide? section 05 • Source: EMSI Class of Worker 2014.4 (QCEW, non-QCEW, self-employed and extended proprietors)
Job change in STEM occupations Science, Technology, Engineering & Math 13,324 12,384 7.6% Industry and occupation 450 Northwest SD Region, MI 442 1.8% Rest of South Dakota 2009 2014 Change • Questions: • How do STEM jobs compare to the state? • What has been the trend of STEM jobs over time? • How important are STEM jobs to the region’s Star and Emerging clusters? section 05 • *Note: STEM and STEM-related occupation definitions from BLS (2010) • Source: EMSI Class of Worker 2014.4 (QCEW, non-QCEW, self-employed and extended proprietors)
Report ContributorsThis report was prepared by the Purdue Center for Regional Development, in partnership with the Southern Rural Development Center and USDA Rural Development, in support of the Stronger Economies Together program. Report Authors Bo Beaulieu, PhD Indraneel Kumar, PhD Andrey Zhalnin, PhD Data Analysis Ayoung Kim Francisco Scott Report Design Tyler Wright This report was supported, in part, by grant from the USDA Rural Development through the auspices of the Southern Rural Development Center. It was produced in support of the Stronger Economies Together (SET) program.
For more information, • please contact: • Dr. Bo Beaulieu, • PCRD Director: • ljb@purdue.edu • Or • 765-494-7273 The Purdue Center for Regional Development (PCRD) seeks to pioneer new ideas and strategies that contribute to regional collaboration, innovation and prosperity. October 2015