Download
1 / 20
200 likes | 272 Views
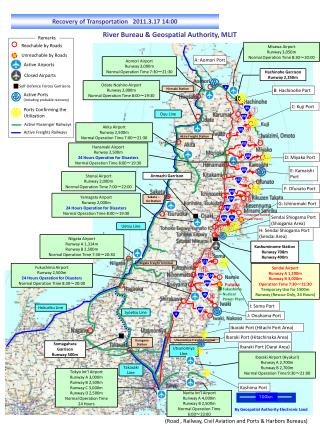
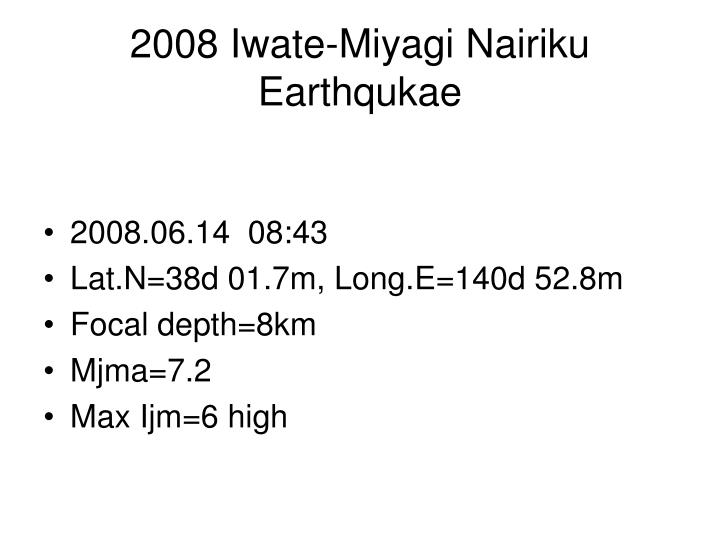
2008 Iwate-Miyagi Nairiku Earthqukae. 2008.06.14 08:43 Lat.N=38d 01.7m, Long.E=140d 52.8m Focal depth=8km Mjma=7.2 Max Ijm=6 high. Location of stations, Blue circle indicates a station where the Max PGA of 4G was observed.

E N D
2008 Iwate-Miyagi Nairiku Earthqukae • 2008.06.14 08:43 • Lat.N=38d 01.7m, Long.E=140d 52.8m • Focal depth=8km • Mjma=7.2 • Max Ijm=6 high
Location of stations, Blue circle indicates a station where the Max PGA of 4G was observed. Inversion of dislocation with records at NIED stations indicated by dark dotts. Red star is the epicenter http://www.k-net.bosai.go.jp/k-net/topics/Iwatemiyaginairiku_080614/inversion/
Aftershock locations with red circle and fault model with source mechanisms Hi-net mechanism from head wave and F-net from wave form inversion http://www.k-net.bosai.go.jp/k-net/topics/Iwatemiyaginairiku_080614/inversion/Figs/fig1.html
Source inversion by tele-seismic observation http://taro.eri.u-tokyo.ac.jp/saigai/iwate/index.html#A
Image of geological section with hypocenter http://www.eri.u-tokyo.ac.jp/topics/Iwate2008/tectonics.html
Distribution of PGA and PGV http://www.k-net.bosai.go.jp/k-net/topics/Iwatemiyaginairiku_080614/Iwatemiyaginairiku_080614_kyoshin.htm ・
Record of extremely large PGA of 4G http://www.k-net.bosai.go.jp/k-net/topics/Iwatemiyaginairiku_080614/IWTH25_NIED.pdf
Soil profile of the station http://www.kik.bosai.go.jp/kik/ftppub/sitepdf/IWTH25-J.pdf
http://www.jishin.go.jp/main/chousa/08jun_iwate_miyagi/p11.jpghttp://www.jishin.go.jp/main/chousa/08jun_iwate_miyagi/p11.jpg Expected events for active faults, Epicenter is indicated with red circle. Lines are the active faults and dark circles are event epicenters.
Dislocation observed by GPS http://www.gsi.go.jp/BOUSAI/h20-iwatemiyagi/080614siryou1.pdf
Active fault are indicated with red lines and epicenter is indicated with a yellow star. http://www.jishin.go.jp/main/oshirase/20080614_iwate_miyagi.htm
Satellite image with red cross for epicenter Parts A and B are location where the representative land slides were occurred. http://www.jaxa.jp/projects/sat/alos/index_j.html
Satellite images before (right) and after (left) the events A natural dam is existing in the left panel, so a lake appears. http://www.jaxa.jp/projects/sat/alos/img/topics_20080615_2l_j.jpg
Natural dam Picture from Yomiuri Newspaper
Satellite images before (right) and after (left) the events A largest land slide is existing in the left panel of 60,000,000m2 http://www.jaxa.jp/projects/sat/alos/img/topics_20080615_3l_j.jpg
Volume of a land slide =1.2km×0.8km×50m≒60,000,000m3 Picture from Mainichi Newspaper
Prof. Ohtsuki found fault trace for this event, sorry for all in Japanese
Fault rupture found by Prof Otsuki, Tohoku Univ. http://www.chunichi.co.jp/article/feature/ntok0021/list/200806/CK2008061602000194.html