Download
1 / 42
420 likes | 556 Views
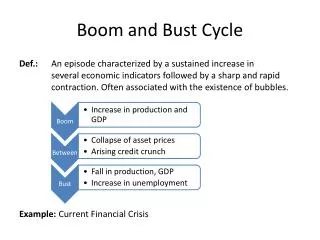
Credit-Induced Boom and Bust. Marco Di Maggio (Columbia) and Amir Kermani (UC Berkeley ). Conference on Housing and Monetary Policy September 5, 2014. Motivation.

E N D
Credit-Induced Boom and Bust Marco Di Maggio (Columbia) and Amir Kermani (UC Berkeley) Conference on Housing and Monetary Policy September 5, 2014
Motivation • The Great Recession was preceded by a large expansion of credit and followed by a collapse in housing prices, employment, and consumption. • The US flow of funds: stock of household mortgage liabilities more than doubled from 2000 to 2006, increasing by 5.7 trillion dollars. • The employment decline was greater than that of any recession of recent decades, peaking at 10% in Oct .09. • Regions that accumulated more debt during this period experienced a larger boom in house prices and consumption which was followed by a larger bust in subsequent years.
Research Question • How much of the boom and the bust in the real economy were due to an outward shift in the credit supply? • Specifically, due to lending to riskier borrowers? Challenges: • Identifying the causal effect of credit is challenging: • Counties that experience higher growth are going to increase their consumption and drive house prices up, but are also going to have higher demand for credit. • As a result, house price and employment increases will be strongly correlated with the supply of credit, even if credit has no direct effect on house prices and consumption.
Identification Strategy • We take advantage of important changes to banking regulation in the U.S. during the early 2000s. • Starting in 1999 several states adopted anti-predatory laws (APL): several restrictions such as requiring verification of borrowers repayment ability, limits on fees, rates and prepayment penalties. • Most importantly, many states included purchase loans to APL. • In 2004 the OCC enacted a preemption rule, which barred the application of state anti-predatory laws to national banks. • National banks and subsidiaries became exempt from APL laws and state enforcement. • We employ this as a positive shock to credit supply in counties with higher fraction of national banks and in states with local APL.
Main Results • Credit Supply: if we compare counties in the top versus the bottom decileof presence of national banks in states with anti-predatory laws the OCC preemption resulted in: • 18% increase in annual loan issuance in years 2004-2006. • Followed by a similar decline in years 2007-2010. • House Prices:using this as an instrument for the supply of credit, we find that a 10% increase in annual loans origination is associated with a 3% increase in annual house price growth rate or a total of 10% increasein house prices from 2004-2006. • Employment: a 10% increase in loan origination leads to a 2-3% increase in employment in the non-tradable sectors. • Delinquencies: a 15% decrease in delinquencies during the boom period, and 30% more delinquencies during the Great Recession. • Heterogeneous Effects: The Boom-Bust pattern is more pronounced in Subprime regions, regions with less affordable housing, and regions with less elastic supply of housing. • Robust to several alternative hypothesis.
Outline 1. Our Contribution 2. Regulatory Framework 3. Data and Research Design 4. Main Results 5. Heterogeneous Effects 6. Robustness Checks 7. Conclusion
Our Contribution Growing literature on the role played by credit supply during the crisis Most of the existing literature investigates how an underlying increase in the credit supply propagates through the economy by using static regional variations, such as the elasticity of housing supply developed by Saiz (2010). In contrast, • We provide an instrument aimed to directly capture an outward shift in the credit supply, which allows us to investigate how lending to riskier borrowers affects real economic activity, controlling for regional differences. • Our paper shows its effect on the boom and bust cycle experienced in several sectors of the economy.
Related Literature • Studies on the great recession: Mian and Sufi (2009, 2014), Kermani (2012). • We complement these studies by exploiting exogenous variation to identify the effect of an outward shift in the credit supply on house prices, employment, and delinquency rates. • Literature on credit booms and financial crisis: Kiyotaki and Moore (1997), Justiniano et al. (2014), Rajan and Ramcharan (2012) , Schularick & Taylor (2012) , Jordà, Schularick & Taylor (2013) • Papers that study the interplay between credit and real economic activity: Mian et al. (2011), Greenstone and Mas (2012), Jiménez et al.(2012), Adelino et al. (2012) and Chodorow-Reich (2014). • Our paper shows the effect of an increase in lending on the boom and bust cycle experienced in several sectors of the economy. • Role of APL: Keys et al. (2010), Ho and Pennington-Cross (2006), Agarwal et al. (2013), Ding et al. (2012). • We use this evidence to motivate the use of APL as source of variation, but to gauge the effect of the credit supply in the aggregate and on real economic activity.
Regulatory Framework • In the U. S. national banks are supervised by the OCC. • Federal thrifts by the OTS. • Independent mortgage companies by HUD • State banks and thrifts chartered at the state level are supervised by either the Federal Reserve System (FRS) or the Federal Deposit Insurance Corporation (FDIC) or by their chartering state. • Credit unions by the National Credit Union administration (NCUA).
Anti-predatory laws • In 1994, Home Ownership and Equity Protection Act (HOEPA): • restrictions on lending terms and practices for mortgages with high prices, based on either the APR or the total points and fees imposed. • However, high cost mortgages only accounted for one percent of residential mortgages. • It only covered refinance loans. • Many states adopted stronger anti-predatory lending regulations than federal law requires. The first law was passed in 1999 by North Carolina. • As of January 2007, 20 states and the District of Columbia had anti-predatory laws in effect. • We focus on the ones that were not replication of Federal Anti-Predatory law.
Do APLs Matter? • Ding et al. (2012): APLs associated with a 43% reduction in prepayment penalties; 40% decrease in ARMs; significant reduction in likelihood to default. Stronger for subprime regions. • Ho and Pennington-Cross (2006): subprime loans originated in APL states had lower APRs than in unregulated states. • Keys et al. (2010): employ the APL as an instrument for the ease of securitization. • Evidence from Rating Agencies: they require credit enhancement, "to the extent that potential violations of APL reduce the funds available to repay RMBS investors, the likelihood of such violations and the probable severity of the penalties must be included in Moody’s overall assessment".
Preemption Rule • On January 7, 2004 the OCC preempted a broad range of state laws attempting to regulate the “terms of credit” from applying to national banks’ activities. • Specifically, the OCC preempted all regulations pertaining the following: • Loan-to-value ratios; • The terms of credit: repayment of principal and interest, amortization, balance, payments due, minimum payments, or term to maturity of the loan; • The aggregate amount of funds that may be loans upon the security of real property; • Access to, and use of, credit reports; • Disclosure and advertising; • Processing, origination, servicing, sale or purchase of, or investment or • participation in, mortgages; • Rates of interest on mortgage loans;
Data • “Home Mortgage Disclosure Act” (HMDA) data set from 1999 through 2011: flow of new mortgage loans originated every year. • It records each applicant's final status (denied/approved/originated), purpose of borrowing (home purchase/refinancing/home improvement), loan amount, race, sex, income, and home ownership status. • We obtain data on the fraction of loans securitized from Blackbox Logic. • The New York Fed Consumer Credit Panel: county level information on loan amounts, mortgage delinquency rates and the fraction of households with FICO scores below 620. • County Business Pattern: employment data (non tradable sectors). • Our county--level house price data from 1999 to 2011 come from Zillow.com • We also add county--level data on demographics, income, and business statistics through the Census. • Anti-Predatory measure from White, Reid, Ding and Quercia (2011)
Research Design (1) The introduction of APL might be correlated with other policies or with unobserved characteristics of the local mortgage market.
Research Design (2) The source of funding and its growth for national banks and independent mortgage lenders were significantly different.
Robustness Checks • Diff-in-Diff • Securitization • StateBorders • CRA Lending • BHC Agency • Loan-Level Evidence Others: Only APL States JP Morgan Chase Aggregate Impact
Robustness III: State Borders • Looking at Census-Tracts within 10-15 miles from state-borders
Aggregate Impact • How much of the increase in house prices can be attributed to a direct effect of an outward shift in the credit supply? • We can integrate our estimated effect to compute the economy wide magnitude of our results. • Compute the ratio between “Fraction OCC x APL” in the loan amount and in the house prices estimations. • For each county, we compute the increase in loan amount minus the 10% decile. • That increase in loan amount times the ratio gives the effect on house prices and then take the average across counties. • For boom of 2003 to 2005: our channel explains 52% of boom in house prices • For bust of 2008 to 2010: our channel explains 67% of decline in house prices • Similarly for employment and delinquency rates. • If consider only the increase in subprime lending, it explains about 20%-25% of boom and bust of house prices. • Similarly, if we consider only the APL states
Conclusion • A change in banking regulation with differential effects on APL states versus the ones without, and on counties with a different presence of national banks provides us with a novel identification strategyto investigate the role of the supply of credit on the boom and bust cycle. • Credit expansion (especially to riskier borrowers) may induce a boom-bust cycle in the real economy. • Time inconsistency of financial regulation: short-term consequences can be very different from long-term ones.