Download
1 / 21
210 likes | 302 Views
MATERIAL BALANCE METHODOLOGY Julia Brown Manager, Process Development. Introduction:.

E N D
MATERIAL BALANCE METHODOLOGY Julia BrownManager, Process Development
Introduction: In an enterprise, the waste and emission problems, appear from the production points where the materials are used, processed and treated. To give a solution to your environmental problems, the sources has to be identified, as well as the volume and the causes of the waste and emissions......
Introduction ..... The substances with which you are working with, have to be known, to estimate its real value in the process and to estimate possible developments during the evaluation.
Definition “Materials Balance analysis (MB) is a systematic reconstruction of the way in which a chemical element, a compound or material passes through a natural cycle and/or its economical benefits. An analysis of the material flow, usually is based on the origin of a physical balance.” German investigation Committe, 1993
Describes or illustrates any material flow present in the enterprise. Trace the waste at the point at which it is generated. Print data so that decisions may be taken. Identify the production process weaknesses. Give a detailed reasonable and quantified priorization of the results to obtain wastes and emissions minimization. Objectives of BM
Identify the materials used by the enterprise. Identify the sources, the volumes and causes of the wastes and emissions. Create a base for the evaluation and prediction of future developments. Define strategies to improve the general situation of the enterprise. Results
Analysis points have to be defined and the parameters that are to be evaluated. The overview or overall effect of the balance has to be defined. The time period considered by the balance has to be defined. The process consequences are defined. The flow diagram is designed. The MB´s are to be generated. Results should be interpreted. How a MB is done?
The process areas that will be studied has to be determined . Analysis as a function of: costs, risks, secure deposit of wastes, volume etc. 1. Analysis Points and Technical Advice
First step is to develop an analysis of input and output of the enterprise. Detailed analysis in relation to the more extensive flows and ecological problems. Definition of each flow’s importance 1. Points of Analysis and Technical Advice
1.1 Conditions of Technical Advice Actual Advice strategy Reactive • Internal rules • Knowledge of the source • Segregation • Reliable points • Variation with the time
The productive process is divided into sequencial steps according to the priority of the analysis and the study of the flows previously done. 2. MB Overview
The representative period of time has to be choosen depending of the type and size of the enterprise. 3. Definition of the period of time
Detailed study of the material flow. Processes are divided according to a representative structure. What are considered processes? activities, equipments, products or utility aspects. 4. Definition of process sequence
Graphic interpretation of the materials flows. It shows volumes, proportions, ecological relevance among other characteristics. Indicate the sequence or steps of the productive process. 5. Flow diagram
Flow Diagram Example Output Input Returned bottles Detergent Residues Caustic soda Residues Org. & inorg. matter First soak by spray Water Water Caustic soda Detergent Vapor Labels+ Caustic soda sol. Residual bath Muds Condensates Caustic soda bath Water Caustic soda Detergent Vapor Residual bath Muds Condensates Caustic soda bath WaterVapor Soak by inmersion Condensates Final soak by inmersion Water Vapor Condensates Washed bottles
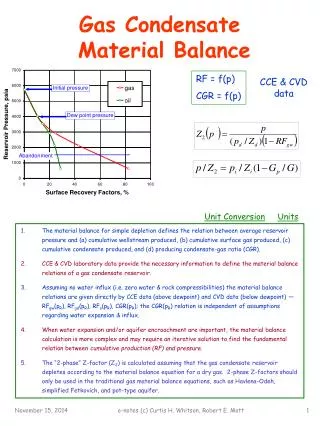
Conservation mass principle is used because it indicates that: Input Material = Output Material Units of measurements given in kg or m3 6. Material Balance
Example 1: Input and Output diagram Auxiliary materials Water Energy Product (expected) Unit Operation Raw material byproduct (usable) Waste Waste easily assimilated by the environment Inert waste always available toxic/dangerous waste
Example 2: Input and Output Raw materials Gaseous emissions Plant, Process or Unit Operación Catalyst Products Air/Water By-products Energy Wastewater Recycle Liquid waste Solid waste Reusable residues in other operation
Establish standards that will establish a relationship between the material consume and the waste generated. Establish the process efficiency indicators. (for example Kwh/coffee produced) 7. Interpretation
One dollar invested in prevention is like one thousand dollars in medicine