Download
1 / 18
180 likes | 191 Views
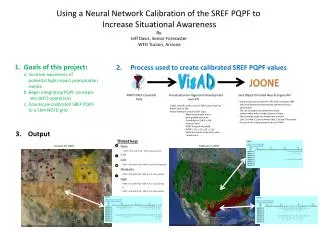
ADAS / Situational Awareness & Collaborative Activities. NASA SPoRT Center Partners’ Meeting. Henry Steigerwaldt SOO WFO Nashville, TN (MAR 3-4 2010). ADAS Analysis Imagery in AWIPS. What’s “ ADAS ” stand for?. (Most info. obtained from SPoRT ADAS training module).

E N D
ADAS / Situational Awareness & Collaborative Activities NASA SPoRT Center Partners’ Meeting Henry Steigerwaldt SOO WFO Nashville, TN (MAR 3-4 2010)
ADAS Analysis Imagery in AWIPS What’s “ADAS” stand for? (Most info. obtained from SPoRT ADAS training module) A = Advanced Regional Prediction System (ARPS) DAS = Data Analysis System • Analysis component of ARPS forecast model (developed by Univ. of Oklahoma), which includes data ingest, quality control and objective analysis. • Better than LAPS which has quality control issues. • Better than MSAS which has smoothed analyses. • Better than RTMA (Real-Time Mesoscale Analysis) which has both quality control and smoothing issues. • Combines a 13-km, 2-hour RUC forecast as background (first guess) field, with METARS, SAOs, Mesonet and Buoy obs from MADIS system. • Runs hourly at H+20, and has 2-km resolution for capturing mesoscale detail (sharper gradients and better terrain analysis). • Incorporates obs from H±15 min. from top of hour, and available in AWIPS at H+40 to H+45. • Output includes 2-m T, Td, RH and 10 m Winds.
AWIPS ADAS default color curve (NASA SPoRT Blog post on this subject) Gradual change in colors makes it harder to diagnose important gradients.
The right color curve brings out the detail, but some colors repeat about 20˚F apart. Location of Frontal System
Here's another curve, but this time with no repeating colors.
What are some uses for ADAS analyses? • Realtimemesoanalysis for forecasting (NOWs, ZFPs), and assisting in updating current forecasts. • Determining precise location and movement of fronts, outflow boundaries, and warm sectors (situational awareness for potential tornadic storms). • Determining “rate” of warm or cold advection. • Assisting in timing of changeover from rain-to-snow or snow-to-rain, especially when boundary layer only portion of sounding above freezing. • Monitoring RH & Wind for potential Red Flag Warning or Fire Wx Watch issuances. • Determining likely locations where frost or freeze occurred in Spring and Fall, and “killing freeze” in Fall for verification purposes. • Initializing short-term grids in GFE. • Verifying gridded forecasts in GFE.
512 PM CST Example Situational Awareness for tornadic storm potential Mesoscale Discussion 512 PM CST
Usage example: Monitoring NE push of warm sector to determine whether elevated storms will become surface based, and tap into high SRH values in low levels for tornadic potential. 06Z ADAS & NCEP frontal analyses
ADAS analysis showed warm sector moved ENE, staying S of Middle TN. SE Composite R 0554Z ADAS06Z No warnings were issued by OHX forecasters
ADAS Issues • Hourly analyses occasionally or frequently missing • Mainly result of non-receipt of RUC Forecasts at SPoRT • Was told SPoRT may replace RUC background fields with higher resolution NSSL runs • Note: If data not there when forecasters need it, they won’t use it anymore! • Analyses good, but could be improved if more Obs data incorporated • Was told SPoRT will work to include other datasets more effectively
ADAS Issues • RAWS Obs - Are RAWS Obs in Middle TN incorporated into analyses via MADIS? • OHX recently began pushing Obs to HUN just in case RAWS (Fire Wx) Observations (Obs in MADIS system) http://raws.wrh.noaa.gov/rawsobs.html
ADAS Issues • AWOS Obs - Not incorporated yet; only available by phone or modem; State says too costly to distribute to NationalAirspace Data Interchange Network (NADIN). • TN WFOs use Modems to obtain data; site access limited to one party at a time (sometimes “busy signal” due to competition between State, WFOs, Pilots, etc.); takes 2 min. for site reset after being accessed. • Until recently, Obs only utilized locally; now pushed between TN WFOs & HUN. • Timeliness prevents use of some Obs (collected outside H±15 min. window) ASOS / AWOS Observations (Only ASOS obs (green circles) used in ADAS analyses)
ADAS Issues • Roadway Obs not incorporated - Only available within TN (not distributed to MADIS by State) • State only collects Obs during cold months of year - Saves State money! TDOT Roadway Observations http://www.trafficweather.info/roadWeather/rwisMap.jsp?client=313
OHX – SPoRT Collaboration • Dr. Geoffrey Stano & Kevin Fuell visited office, gave two presentations, met with staff, & received forecaster feedback. (9/2/08) • Had numerous discussions (phone & email) on various topics mainly between Geoffrey and OHX SOO & ITO • Office took part in SPoRT’s “GOES Fog Depth Product Assessment” period • Office took part in SPoRT’s “MODIS Fog Product Assessment” period • Blog post on MODIS Fog Product (SOO) • Blog post on ADAS (SOO) • Forecasters / SOO completed some LMA surveys • Used SPoRT Request Support Webpage to submit several product problems
OHX – SPoRT Collaboration Example…GOES Fog Depth Product • Assessment in email to Geoffrey & Kevin (5/30/09) • Resulted in better quality TAF • Comment…“15 min. updates were very important, which showed northeast expansion / development of fog / low clouds across Cumberland Plateau and into Crossville area and beyond. This product gave me more confidence to change lowest visibilities and low cloud ceilings forecast in TEMPO group and instead place those conditions in "general" (i.e. prevailing) group in TAF for CSV.” • Allowed enhanced dense fog location specificity in Text & Graphical Nowcasts • Comment…”Issued Text Nowcast and Graphical Nowcast to mention most likely locations to experience dense fog early this morning.”
OHX – SPoRT Collaboration Example…LMA Product