Download
1 / 1
10 likes | 92 Views
#. denser atmospheric air. Constant Head. less dense fracture air. Constant Head.

E N D
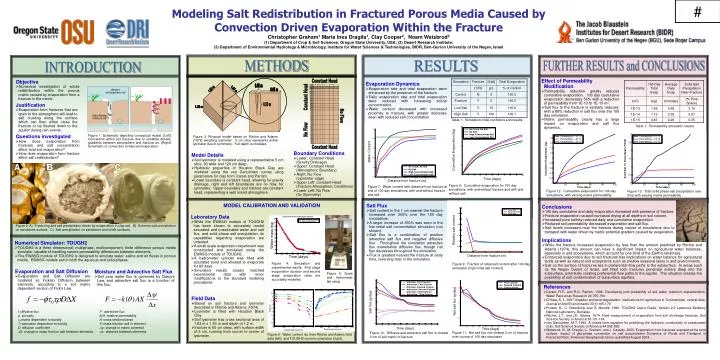
# denser atmospheric air Constant Head less dense fracture air Constant Head Figure 1: Schematic depicting conceptual model. (Left) Convection within soil fracture due to unstable density gradients between atmosphere and fracture air. (Right) Schematic of convection enhanced evaporation. Soil Matrix No Flow No Flow Constant Head Water mass (kg) Relative salt content Time (days) Figure 9: Fraction of initial salt content after 100 day simulation (high initial salt content) Salt flux (g/day) Net salt flux (g/day) Time (days) Time (days) Figure 11: Net salt flux into closest 3 cm of fracture over course of 100 day simulation Figure 10: Diffusive and advective salt flux in closest 3 cm of soil matrix to fracture Modeling Salt Redistribution in Fractured Porous Media Caused by Convection Driven Evaporation Within the Fracture Christopher Graham1 Maria Ines Dragila1, Clay Cooper2, Noam Weisbrod3 (1) Department of Crop & Soil Sciences, Oregon State University, USA; (2) Desert Research Institute;(3) Department of Environmental Hydrology & Microbiology, Institute for Water Sciences & Technologies, BIDR, Ben-Gurion University of the Negev, Israel METHODS FURTHER RESULTS and CONCLUSIONS RESULTS INTRODUCTION • Effect of Permeability Modification • Permeability reduction greatly reduces cumulative evaporation. 100 day cumulative evaporation decreases 56% with a reduction of permeability from 1E-13 to 1E-15 m2. • Salt flux to the fracture is similarly reduced, with a 88% reduction in salt flux over the 100 day simulation. • Matrix permeability clearly has a large impact on evaporation and salt flux dynamics. • Objective • Numerical investigation of solute redistribution within the porous matrix caused by evaporation from a fracture in the matrix. • Evaporation Dynamics • Evaporation rate and total evaporation were enhanced by the presence of the fracture. • Daily evaporation rate and total evaporation were reduced with increasing solute concentration. • Water content decreased with increased proximity to fracture, with greater decrease seen with reduced salt concentration • Justification • Evaporation from fractures that are open to the atmosphere will lead to salt crusting along the surface which can then either close the fracture or be flushed down to the aquifer during rain events. Table 1: Simulation initial conditions and results. Table 1: Permeability simulation results. • Questions investigated • How does evaporation from fractures and salt concentration affect total soil evaporation? • How does evaporation from fracture affect salt redistribution? Figure 3: Physical model based on Ritchie and Adams (1972) weighing lysimeter. 5 cm slice represents entire lysimeter due to symmetry. Full depth is modeled. Cumulative Evaporation (kg) Water Content • Boundary Conditions • Lower: Constant Head (Gravity Drainage) • Upper: Constant Head (Atmospheric Boundary) • Right: No Flow (Lysimeter edge) • Upper Left: Constant Head (Fracture Atmospheric Conditions) • Lower Left: No Flow (for Symmetry) • Model Details • Soil lysimeter is modeled using a representative 5 cm slice, 60 wide and 120 cm deep. • Hydraulic properties of Houston Black Clay are modeled using the van Genuchten curves using parameters for clay from Carsel and Parrish. • Lower boundary is constant head, allowing for gravity drainage, right and left boundaries are no flow, for symmetry. Upper boundary and fracture are constant head, representing a well mixed atmosphere. A B C Time (days) Distance from fracture (m) Figure 8: Cumulative evaporation for 100 day simulations, with and without fracture and with and without salt. Figure 7: Water content with distance from fracture at end of 100 day simulations, with and without fracture and salt Figure 12: Cumulative evaporation for 100 day simulations, with varying matrix permeability. Figure 13: Total solid phase salt precipitation over time with varying matrix permeability MODEL CALIBRATION AND VALIDATION • Salt Flux • Salt content in the 1 cm nearest the fracture increased over 300% over the 100 day simulations. • A larger increase of 350% was seen in the low initial salt concentration simulation (not shown). • Salt flux is a combination of positive advective salt flux and negative diffusive flux. Throughout the simulation advective flux overwhelms diffusive flux, though net flux decreases throughout the simulation. • Flux is greatest nearest the fracture at early time, reversing later in the simulation. • Conclusions • 100 day cumulative and daily evaporation increased with presence of fracture. • Fracture evaporation caused increased drying at all depths in soil column. • Increased pore salinity reduced daily and cumulative evaporation. • Reduced soil permeability decreased evaporation and salt flux. • Salt levels increased near the fracture during course of simulations due to transport with water driven by matric potential gradient caused by evaporation. • Laboratory Data • While the EWASG module of TOUGH2 has been shown to accurately model saturated and unsaturated water and salt flux, and solid phase salt precipitation, its capabilities regarding evaporation are untested. • A small scale evaporation experiment was constructed and simulated using the EWASG module of TOUGH2. • A hydrometer cylinder was filled with saturated sand and allowed to evaporate for 80 days. • Simulated results closely matched experimental data with minor modifications to the standard modeling procedures. Figure 2: A) Fracturing and salt precipitation driven by evaporation in clay soil. B) Extreme salt precipitation on sandstone surface. C) Salt precipitation on sandstone and chalk surfaces. • Implications • While the fracture increased evaporation by less than the amount predicted by Ritchie and Adams (1974), this amount can have a significant impact on agricultural water balances, especially in arid ecosystems, which account for one third of the Earth’s landmass. • Enhanced evaporation due to soil fractures has implications on water balance for agricultural lands as well as natural arid ecosystems such as shallow seasonal lakes in arid environments. • Salt on the surface of fractures lies in preferential flow paths to the subsurface. In areas such as the Negev Desert of Israel, salt filled rock fractures penetrate meters deep into the subsurface, potentially creating preferential flow paths to the aquifer. This situation creates the possibility of salt contamination of subsurface aquifers. F. Botts • Numerical Simulator: TOUGH2 • TOUGH2 is a three dimensional, multiphase, multicomponent, finite difference porous media simulator capable of handling severe permeability differences between elements. • The EWASG module of TOUGH2 is designed to simulate water, saline and air fluxes in porous media. EWASG models salt in both the aqueous and solid phases. Distance from fracture (m) Figure 4: Simulation and experimental results. First stage evaporation duration and second stage evaporation rates are accurately modeled. • Evaporation and Salt Diffusion • Evaporation and Salt Diffusion are modeled as Fickian Diffusion between elements, according to a soil matrix dependent version of Fick’s Law: • Moisture and Advective Salt Flux • Soil pore water flux is governed by Darcy’s Law, and advective salt flux is a function of this flux: Figure 5: Scale and hydrometer lab setup • References • Carsel, R.F., and R.S. Parrish. 1988. Developing joint probability of soil water retention characteristics. Water Resources Research 24:755-769. • O’Hara, S. L. 1997 Irrigation and land degradation: implications for agriculture in Turkmenistan, central Asia. Journal of Arid Environments 37(1):165-179 • Pruess, K., C. Oldenburg, and G. Moridis. 1999. TOUGH2 User's Guide, Version 2.0 Lawrence Berkeley National Laboratory, Berkeley. • Ritchie, J.T., and J.E. Adams. 1974. Field measurement of evaporation from soil shrinkage fractures. Soil Science Society of America 38:131-134. • van Genuchten, M.T. 1980. A closed form equation for predicting the hydraulic conductivity of unsaturated soils. Soil Science Society of America 44:892-898. • Weisbrod, N., M. Dragila, C. Graham, and J. Cassidy. 2005. Evaporation from fractures exposed at the land surface: impact of gas-phase convection on salt accumulation Dynamics of Fluids and Transport in Fractured Rock. American Geophysical Union, submitted August 2004. • Field Data • Based on soil fracture and lysimeter described in Ritchie and Adams (1974). • Lysimeter is filled with Houston Black Clay • Soil lysimeter has cross sectional area of 1.83 m x 1.83 m and depth of 1.2 m. • fracture is 50 cm deep, with surface width of 5 cm, running from corner to corner of lysimeter. f: diffusive flux f: porosity t0:matrix dependent tortuosity T: saturation dependent tortuosityD: diffusion coefficientDX: change in mass fraction salt between elements. F: advective fluxk(q): relative permeabilityA: cross sectional areaX: mass fraction salt in elementDy: change in matric potentialDx: distance between elements Figure 6: Water content iso lines Ritchie and Adams field data (left), and TOUGH2 numeric simulation (right).