1 / 0

September 2010

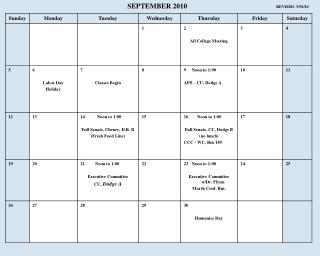
Introduction to Carbon An Enterprise Performance Diagnostic and Modelling Technology. September 2010. Integrated Budgeting and Mine Planning – Our Take. Design and Planning. Performance Management. Physical Actuals. Variance Reporting. Exploration. Mining. Beneficiation. Sell .

dobry
Download Presentation

September 2010

An Image/Link below is provided (as is) to download presentation Download Policy: Content on the Website is provided to you AS IS for your information and personal use and may not be sold / licensed / shared on other websites without getting consent from its author. Content is provided to you AS IS for your information and personal use only. Download presentation by click this link. While downloading, if for some reason you are not able to download a presentation, the publisher may have deleted the file from their server. During download, if you can't get a presentation, the file might be deleted by the publisher.

E N D

Presentation Transcript


  1. Introduction to Carbon An Enterprise Performance Diagnostic and Modelling Technology September 2010
  2. Integrated Budgeting and Mine Planning – Our Take Design and Planning Performance Management Physical Actuals Variance Reporting Exploration Mining Beneficiation Sell Tier 1 Activities Plan - what where and when Tier 2 Activities Marketing Sample Selling Drill Process Develop Refine Stope Performance Management Economic Actuals Budget Cause/Effect Analysis
  3. Integrated Budgeting and Mine Planning Design and Planning Performance Management Actuals Planning History Mine 24D MineRP Spatial Dashboard Variance Reporting Geo-Technical CADSmine Exploration Mining Beneficiation Sell Tier 1 Activities APMOT Plan - what where and when Tier 2 Activities Marketing Sample Selling Drill Process Develop Refine Stope Performance Management Economic Carbon Actuals Budget Cause/Effect Analysis
  4. Contents The Concept Its Application Technology Demonstration
  5. Contents The Concept Its Application Technology Demonstration
  6. In the Simplest of Terms Carbon in A Modelling Technology A model is a mathematical representation of a system (current or future reality). This can be a business system, an ecosystem, an energy system, etc.). A system implies the existence of cause / effect relationships between variables; e.g. If this variable changes then that will be the impact on another variable. A model will express in numbers the resultant change, or impact on the affected variable. At the most basic level, all models comprise three components: 1 2 3 An Input Variable A Relationship And an Output Variable “What the modelling analyst can change to test or simulate scenarios.” “The result, or that is impacted on by a change to the input variable “A quantification of cause / effect between variables.” r1 v1 r2 v2
  7. Enterprise Modelling Practical enterprise models comprise a “network” of hundreds and even millions of variables and relationships. Model ‘links’ different worlds, e.g. operations and economics. All models are (or should be) built for a distinct set of purpose(s). Broadly speaking, in the enterprise context, there are two general applications of models: As a planning tool; As a diagnostic tool. Operational Variables Outputs Physical Variables Economic Variables Inputs Inputs Inputs Inputs
  8. Graphical Overview of the Carbon Object Oriented Modelling Suite – An object is the basic building block of all Carbon models In its most basic form the Carbon modelling platform consists of a generic ‘object’ An ‘object is a mathematical representation of whatever the model builder wants it to be. In other words the object will ‘behave’ exactly like the real world item that it represents An object is made up of 4 components - annotations, intrinsic attributes, behavioural attributes and performance metrics. Intrinsic Attributes - Intrinsic Attributes represent numeric characteristics that directly relate to the object– i.e. their values are independent of the interaction with other objects. Examples are: Unit cost, capacity or density Behavioural Attributes - Behavioural Attributes represent numeric characteristics of the object that are dependent on the object’s interaction with other objects. For example if we have a diesel object, its consumption rate (behavioural attribute) will be a function of the type of machineconsuming it and the speed of that machine. Performance Metrics - Performance Metrics represent the results of the object interacting with their environment (i.e. other objects). The result is calculated using one or more formulae associated with the performance metric. The formulae can be simple linear, or more complex non-linear and can be different over time. Annotations Annotations represent information that describe or classify an object. Annotations comprise a name and descriptive content. The annotation name describes the kind of information and the content is the information itself This is useful in determining if an object must be rolled up (or added) to other objects for reporting purposes Examples are: Furnace Type = type A Cost Centre = 10032 A Generic Carbon Object The technology is called Carbon because like the carbon atom which remains consistent, but depending on how it is organised it can form a diamond, a lump of coal, living wood, etc. Similarly a generic Carbon object can create whatever the modeller requires. 8
  9. Graphical Overview of the Carbon Object Oriented Modeling Suite – the modeling platform is n-dimensional Importantly - Annotations, Attributes and Logic can be made to vary over a dimension such a time for example (e.g. useful for calculating depreciation, or the escalation of costs as mines expand with age). This makes for a very powerful modeling environment. The Same Object In the Future could have different annotations, attributes and performance metrics A Carbon Object Today Intrinsic Attributes Intrinsic Attributes Intrinsic Attributes Intrinsic Attributes Behavioural Attributes Behavioural Attributes Behavioural Attributes Behavioural Attributes Annotations Annotations Annotations Annotations Time (months ? Days? Minutes? Years?) Or Scenarios, etc. Performance Metrics Performance Metrics Performance Metrics Performance Metrics 9
  10. Graphical Overview of the Carbon Object Oriented Modeling Suite – objects can be instantiated to create libraries of similar items A generic Carbon object can be instantiated into a type of entity named ‘truck’ with data placeholders and relationships specific for that truck. A Generic Carbon Object Intrinsic Attributes Becomes Behavioural Attributes Annotations An Object called a Generic Truck Performance Metrics Intrinsic Attributes Unit Cost Capacity Becomes A Specific Object called a CAT 777 Annotations Behavioural Attributes Location – cycle time relationship Speed – fuel consumption relationship Fleet ID Location Age Replacement date Intrinsic Attributes CAT777 and client specific data Performance Metrics Tons transported Operational cost Cost per ton Behavioural Attributes Annotations Calculated performance Industry and Client specific identifiers Performance Metrics CAT 777 ‘nameplate’ data Client ‘actual’ data 10
  11. 11 What Does the Raw Materials Resource Type Object Look Like? Raw Material Intrinsic Attributes Input Attributes Unit cost Resource Behavioural Attributes Annotations Object Type = InputResource Resource Name = .... Resource Type = Raw Material Cost Centre = .... Department = ... Linked Activity = .... Consumption rate per unit of production Bill of material ratio Loss % Performance Metrics These are all calculated metrics as a result of how the resource is being consumed Total quantity consumed Total usage cost
  12. 12 What Does an Activity Object Look Like? These are input metrics that determines how an activity performs Activity Intrinsic Attributes Behavioural Attributes Annotations Object Type = Activity Activity Name = .... Activity Type = Production / Service Cost Centre = .... Department = ... Preceding Activity = .... (allows the output resource from the previous activity to become an input resource in this activity) Linked host entity = ... Behavioural Attributes for an activity relate to things such as the efficiency with which each resource is consumed in the activity – since these parameters are relevant for each resource, we choose to place them on the resources themselves. Carbon Activity Object Performance Metrics Total operating cost Total capital cost Total quantity of resource produced Operating efficiency Capital efficiency (Revenue) (Profit) These are all calculated metrics as a result of how the activity performs If revenue can be attributed to the output resource – e.g. If the resource is sold, or their is an internal transfer price
  13. The “Produce – Consume” Logic Implicit in a Value Chain Model At The Consolidated Group Level Revenue Working Cost Capex Value gained Total cash in flow Resources consumed Total expenditure At the activity / asset level Drill Blast Haul Etc Gain Consume Gain Consume Gain Consume Bench drilled Accuracy Labour • Power • Water • Etc • Tons broken Muck pile slope Exposure • Labour • Etc • Tons cleared Fuel • Labour • Etc •
  14. 14 Overview of the 5 Types of Input Resources Objects Consumables Labour Raw Material Resource Machines & Equipment Land and Buildings Object Type, Resource Name, Resource Type, Cost Centre, Cost Category Department, Linked Activity Object Type, Resource Name, Resource Type, Cost Centre, Cost Category Department, Linked Activity Object Type, Resource Name, Resource Type, Cost Centre, Cost Category Department, Linked Activity Object Type, Resource Name, Resource Type, Cost Centre, Cost Category Department, Linked Activity Object Type, Resource Name, Resource Type, Cost Centre, Cost Category Department, Linked Activity Annotations Unit cost per unit of availability (depreciation rate) Capacity INPUT attributes Unit cost Unit cost Unit cost Intrinsic Attributes Unit cost per unit of usage Availability & Capacity Availability Purchase price Purchase price Consumption rate per unit of production Efficiency (utilisation per unit of output) Efficiency (utilisation per unit of output) Consumption rate per unit of time Usage Behavioural Attributes Bill of material ratio Loss % CALCULATED metrics as a result of how the resource is being consumed Utilisation No of machines / equipment Total quantity consumed Quantity consumed No of labour units Total usage cost Performance Metrics Utilisation Total usage cost Total usage cost Total usage cost Total usage cost Total capital cost
  15. Overview of a Mine Model Logic The object oriented model is made up of literally thousands of ‘objects’ which can be classified into one of the following categories – a production entity (shaft, mechanical); an Activity (drilling, hoisting) and a Resource (Labour, bill of materials etc). All of these ‘objects’ are related making this an element, an activity and an area/geological based model at the same time. An Objects Attributes / Behavioral logic Production Entity Activity Cost Driver Rate Resource Logic (Formulae) Each object contains a multi-dimensional data cell: (eg Variable, Scenario, Time). Formulas can be set on specific cells – i.e. calculating costs: [Cost] = [Driver] * [Rate] Time Scenarios
  16. Overview of a Mine Model Logic Group Operation 1 Operation 2 Operation 3 Central 1 Central 2 West Section East Section North Section … … Shaft Complex 2 Shaft Complex 1 Shaft Complex N … … Main, Sub or Tertiary Shaft Production Entity Activity Resource Level N Level 1 …
  17. Overview of a Mine Model Logic Group Operation 2 Central 1 Central 2 West Section East Section North Section … … Shaft Complex 2 Shaft Complex 1 Shaft Complex N … … Main, Sub or Tertiary Shaft Level N Level 1 … Production Entity Activity Resource
  18. Overview of a Mine Model Logic Group Operation 2 Central 1 Central 2 West Section East Section North Section … … Shaft Complex 2 Shaft Complex 1 Shaft Complex N … … Main, Sub or Tertiary Shaft Level N Level 1 … Mining Stoping Development … Engineering Vertical Engineering Horizontal Engineering … Production Entity Activity Plant Routing Resource …
  19. Overview of a Mine Model Logic Group Operation 2 Central 1 Central 2 West Section East Section North Section … … Shaft Complex 2 Shaft Complex 1 Shaft Complex N … … Main, Sub or Tertiary Shaft Level N Level 1 … Mining Labour Object (MO) Stoping Cost Object (Consumables) Cost Object (Sundries) Development … Labour Object (Eng. Manager) Engineering Cost Object (Consumables) Vertical Engineering Cost Object (Sundries) … Production Entity Routing Object (Shaft Complex to Plant) Sub-Activity Plant Routing Resource …
  20. A Structured Multidimensional Modelling Engine An Objects Attributes / Behavioral logic Cost Driver Rate Logic (Formulae) Time Scenarios Production Entity Activity Illustrative Application Four Object Types Group Resource Attribute Each object contains a multi-dimensional data cell: (eg Variable, Scenario, Time). Formulas can be set on specific cells – i.e. calculating costs: [Cost] = [Driver] * [Rate] Shaft Complex 2 Shaft Complex 1 Shaft Complex N … Tertiary Shaft Primary Shaft … Level N Level 1 … Stoping Labour Bill of Materials … Sundries Development
  21. Objects Can Comprise Different Component Objects Classes of Objects Can be organized into a hierarchy of objects that relate to each other mathematically The object Production Area comprises two fleets Production Area Here is the really useful thing – change any parameter of any vehicle (e.g. its logic, annotation or attribute), and all relevant vehicles in the library will change automatically and so to will the impact on any production area that has that vehicle in its fleet. (e.g. change efficiency or fill factor of a CAT 777and production area NPV will change) In this way libraries can be maintained centrally and deployed universally Fleet Fleet The two fleets in turn comprise specific vehicles A Generic Carbon Object is used to create a library of different vehicles Vehicle Library A Generic Carbon Object Vehicle A Vehicle B Vehicle C Vehicle D Intrinsic Attributes Annotations Behavioural Attributes Performance Metrics
  22. 22 How do activities and resources interact to model behaviour? Library of Generic Object Types Object Type=Activity Activity name=Blasting Activity Type=Production Preceding Activity=undefined Linked host entity=undefined Production Activity Production Activity Raw Material Consumable Consumable Labour Total operating cost Revenue Profit Total capital cost Total quantity Operating efficiency Capital efficiency Object Type = Output Resource Resource Name=Broken Rock Production Activity=Blasting Machine / Equipment Building / Land Object Type = Input Resource Resource Name=Explosives Resource Type = Raw Material Linked Activity=Blasting Quantity produced Unit cost Total operational cost Revenue Profit Consumption rate Capital cost Capital efficiency Quantity consumed Unit cost Output Resource Output Resource Total usage cost
  23. 23 A More Complete Blasting Activity Library of Generic Object Types Production Activity Production Activity Raw Material Raw Material Consumable Consumable Consumable Labour Labour Activity name=Blasting Resource Name=Drilled Face Resource Name=Broken Rock Machine / Equipment Machine / Equipment Building / Land Resource Name=Explosives Resource Name=Explosives accessories Resource Name=Blasting Teams Output Resource Output Resource Resource Name=Blasting System
  24. 24 A More Complete Blasting Activity Production Activity Production Activity Raw Material Raw Material Consumable Consumable Consumable Labour Labour Activity name=Blasting Activity name=Drilling Resource Name=Stopable Face Resource Name=Drilled Face Resource Name=Broken Rock Machine / Equipment Machine / Equipment Resource Name=Explosives accessories Resource Name=Electricity Resource Name=Explosives Resource Name=Drilling Teams Resource Name=Blasting Teams Output Resource Resource Name=Blasting System Resource Name=Drill rigs
  25. 25 Activities in the Context of an Organisational Structure Mine Shaft 1 Shaft 2
  26. 26 Extending the Enterprise Economic Model using Techno-Engineering Models Machine Availability Consumption Rate Techno-Engineering Model Techno-Engineering Model
  27. Overview of the Value Driver Tree Presenation A value driver tree is a model that clearly highlights the impact of different operational and technical variables (both controllable and non-controllable) on the economic and financial performance of any business. Financial Metrics (NPV, ROI) Value trees expose the relationship between different variables across the operations. This ability is therefore able to clearly indicate where the most important areas to focus are at different times. Economic Metrics (cost, profit) Cause ... and Effect Operational Output Metrics (volumes, capacity) Production Metrics (efficiencies / plant utilisation) Technical Metrics (Raw material quality, fill factors) – Controllable – Non-Controllable
  28. Overview of Value Driver Trees (cont.) Driver tree models are typically snapshots in time. But In order to be practical, they need to consider relationships over time too, clearly showing what what has happened in the past, and more importantly what is likely to happen in future . Past Future Current Time “Vertical Analysis” How do different operational variables impact performance at any given point in time? ...And “Horizontal Analysis” How will these different variables change over time?
  29. Creating Value Driver Trees from our Periodic Table Objects Object Navigator Drilling Mine The object model of host entities, activities and resources can be transposed into a tree like navigation structure – our “Object Navigator” Shaft 1 Blasting Broken Rock Shaft 2 Blasting Teams Blasting System Explosives Drilled Face
  30. Creating Value Driver Trees from our Periodic Table Objects Value Driver Canvas Object Navigator Drilling Mine Based on an object selection, the Value Driver Canvas will render a value tree using the attributes and performance metrics of that object with their associated relationships. Shaft 1 Blasting Broken Rock Shaft 2 Blasting Teams Blasting System Explosives Drilled Face
  31. Overview of Value Driver Trees (cont.) There are three generic types of value driver tree, (all of which are fully compatible with each other), the financial /economic driver tree; the value chain or activity value driver tree; and the techno-engineering value driver tree. All three of these models can be operated either as stand alone or integrated as one large model. The financial /economic driver tree comprises both economic and financial metrics, and typically follows a format that is largely determined by finance and accounting standards and can be standardised across all mining operations (for example Standard BME or basic mining equation). These models will calculate the impact on long term financial metrics such as value that would result form a change in economic drivers or variables such as volume, price or overall levels of efficiency Financial / Economic The value chain or activity driver tree format models the entire value chain, this type of model will be common hence re-useable for similar mining methods (e.g. Open cast, underground etc.) These models will calculate the impact on operational outputs such as volumes that would result from a change to variables such as the throughput, capacity, utilisation or efficiency of each activity Value Chain / Activity Activity 1 Activity 2 Activity32 Techno-Engineering Etc. Etc Capacity Finally the Techno-Engineering Model will be specific to a particular mine. This level of modelling captures of the technical detail of both specific activities as well as of specific assets such as, fill factors, drill hole patterns, drill rate, ventilation requirements etc. Etc Dimensions Etc Etc Characteristics
  32. Overview of Value Driver Trees (cont.) Here a list of typical inputs and outputs for each model type are clearly shown. Please not that each model archetype can operate as a stand alone, or can be ‘plugged-in’ where the outputs of more details modules serve as the inputs to the models ‘above’. Please see the next three slide for examples of each modelling archetype. Financial / Economic Typical Outputs NPV, ROI, EVA Capital Efficiency, etc. Each module can operate as a stand alone model, where scenarios can be modelled by varying the input parameters Volumes, prices, overall efficiencies, fixed variable cost ratios, etc. Typical Inputs Volumes, capacity bottlenecks (by activity) ,throughput accounting – cost efficiencies, etc. Typical Outputs Value Chain / Activity Activity 1 Activity 2 Activity32 Utilisation rates, specific resource efficiencies, asset capacities , etc. Typical Inputs Techno-Engineering Capacities, throughput, costs per asset , activity costs Typical Outputs Etc. Etc Capacity ...Or Each model will be able to plug into the next In other words the output of one model will be the input into the one above Etc Dimensions Etc Etc Temperature, grade, fill factor, dimensions, etc. Characteristics Typical Inputs
  33. Contents The Concept Its Application Technology Demonstration
  34. Three Key Business Benefits of Driver Trees Driver trees bring about focus – they indicate exactly what is happening in the organization, where it is happening and most importantly why it is happening. They enable proactive response – by quantifying what will happen if one does nothing (probabilistically based) and more importantly quantifying what would happen if different strategies were pursued, and in so doing allows for the micro- optimization of operations. Drivers trees are a language - they bring about a clear, common and unambiguous understanding of complex problems by a diverse range of functional disciplines.
  35. ‘Live Value Driver Trees’ in the Business Context Used as a planning tool, models, in the simplest of terms, answer the question, “If we did this, then what would be the consequence?”. Used as a diagnostic tool, models in effect work in reverse to planning models in that they answer the question, “What is the reason for something having happened?”. Change in price P1 P2 P3 V Revenue Used ‘backwards’, a model is used as a diagnostic tool to understand what and why something happened. Historical Orientation Worked ‘forward’, a model is used as a planning tool to quantify what would happen if. Future Orientation Change in volume Total Cost Change in Efficiency Profit VC1 VC2 V VC3 Fixed Cost FC1 FC2 FC3 Total Cost Change in fixed cost structure
  36. Plan – Monitor – Replan (Continuously) Another perspective on the ‘plan, monitor, re-plan’ continuous cycle Time Plan Monitor Re-Plan A growth period 1 Value Creation (NPV, ROI, Profitability etc.) Plan A harvest period An investment period Resource Consumption (e.g. working cost, development capital, replacement capital, etc)
  37. Plan – Monitor – Replan (Continuously) Another perspective on the ‘plan, monitor, re-plan’ continuous cycle Time Plan Monitor Re-Plan A growth period 1 Value Creation (NPV, ROI, Profitability etc.) Plan A harvest period An investment period Different scenarios are tested before committing to the optimal plan Resource Consumption (e.g. working cost, development capital, replacement capital, etc)
  38. Plan – Monitor – Replan (Continuously) Another perspective on the ‘plan, monitor, re-plan’ continuous cycle Time Plan Monitor Re-Plan A growth period 1 Value Creation (NPV, ROI, Profitability etc.) Plan Variance analysis A harvest period An investment period Cause/Effect Analysis 2 Monitoring ‘actuals’ Different scenarios are tested before committing to the optimal plan Resource Consumption (e.g. working cost, development capital, replacement capital, etc)
  39. Plan – Monitor – Replan (Continuously) Another perspective on the ‘plan, monitor, re-plan’ continuous cycle Time Plan Monitor Re-Plan A growth period 3 RePlan 1 Value Creation (NPV, ROI, Profitability etc.) Plan Variance analysis Testing of different remedial tactics(Micro optimisation) A harvest period An investment period Cause/Effect Analysis 2 Monitoring ‘actuals’ Different scenarios are tested before committing to the optimal plan Resource Consumption (e.g. working cost, development capital, replacement capital, etc)
  40. Contents The Concept Its Application Technology Demonstration
  41. The logic of the organisation: Linking operational drivers to value Value metric: Financial contribution Operational driver that management controls: Advance per blast
  42. What is going on: Clicking on a metric gives multiple perspectives of that metric Each node displays and compares multiples scenarios, Actuals are 21.8% above budget. The what-if allows us to assess the impact of new values, calculated using the logic of the organisation.
  43. What is going on: Clicking on a metric gives multiple perspectives of that metric A pareto chart showing how group contribution is made up, from the contribution of the underlying operations. Clicking on contribution... A waterfall chart explains the difference between actual and budget at group level in terms of the relative performance of the underlying operations. A waterfall chart to explain the difference between budget and actual in terms of the metrics in the value tree that make up contribution (revenue, cost and capex) A time chart to show and help identify historical trends.
  44. Where is it happening: drilling down to problem areas By clicking on the operation that is adversely contributing to performance, you drill down to locate the area of responsibility where the biggest problem lies. We are taken to raiseline 3 where we have the biggest problem.
  45. Why is it happening - What are the drivers causing the problem in raiseline 3? The history chart shows that this raiseline has been a consistent problem. At first glance the metric waterfall chart tells us that the issue is due to lower than budgeted revenue, not capital or cost.
  46. Why is it happening - What are the drivers causing the problem in raiseline 3? A more in-depth analysis, using the attribution analysis tool, tells us that the top 3 drivers driving to the variance in contribution are face length, grade and advance per blast. We can see exactly how much each has impacted contribution.
  47. What can I do about it – which levers do I focus on to get back on track? A sensitivity analysis helps us identify which drivers have the biggest impact on contribution. Focusing on the ones that have the greatest influence can help us get back on track.
  48. What Can I do about it – What if analysis performed on Advance per Blast and Lost Blasts
  49. What Can I do about it – Is my plan realistic? Current what if value An analysis of historical lost blasts shows that I have never achieved less than 1 lost blast in the previous 12 months. Is a value of 1 realistic?
  50. Results of What-If Analysis on Contribution If we achieve the what-if value in the next month, we can improve our performance from R2.75m to R5.39m – but we still need to do more to achieve budget.
  51. Switching to dial view
More Related