1 / 1

GAP

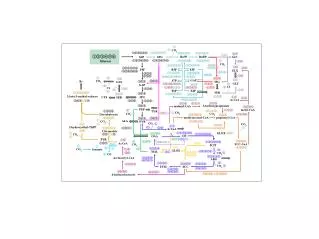
Houston et al., 2009 Figure S2. (Glycolysis). (Glycolysis Bypass). GAP. GAP. (12). NAD. GAPC. 5.56. NADH. NADP + H 2 O. (1). NP-GAPDH. 1,3-bPGA. 0.09. (4). NADPH + 2H +. ADP. PGK. 0.96. ATP. 3-PGA. 3-PGA.

dobry
Download Presentation

GAP

An Image/Link below is provided (as is) to download presentation Download Policy: Content on the Website is provided to you AS IS for your information and personal use and may not be sold / licensed / shared on other websites without getting consent from its author. Content is provided to you AS IS for your information and personal use only. Download presentation by click this link. While downloading, if for some reason you are not able to download a presentation, the publisher may have deleted the file from their server. During download, if you can't get a presentation, the file might be deleted by the publisher.

E N D

Presentation Transcript


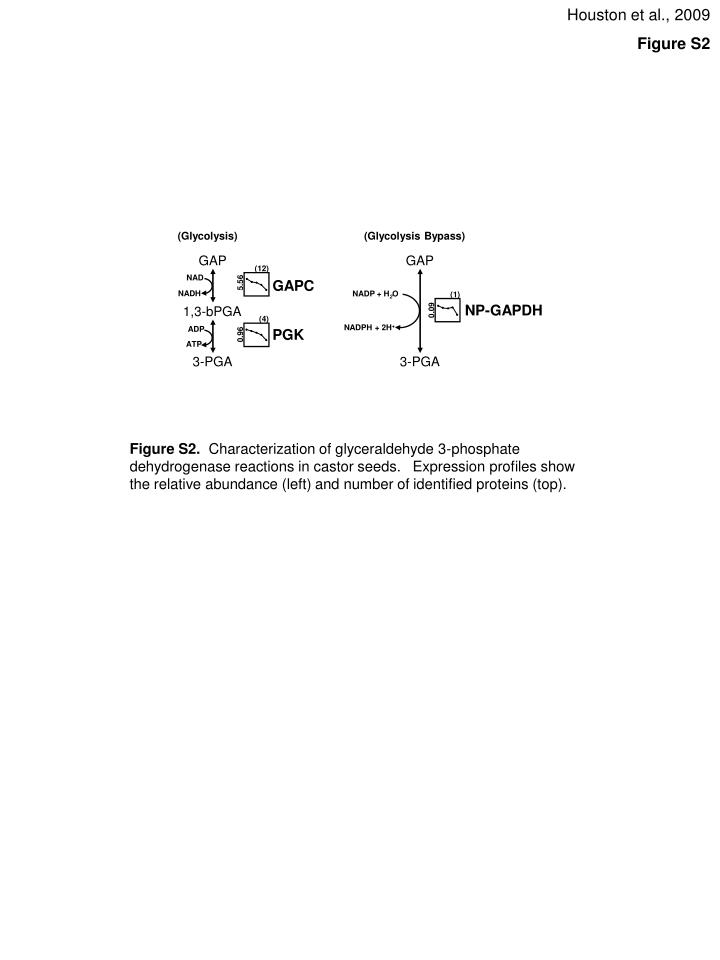
  1. Houston et al., 2009 Figure S2 (Glycolysis) (Glycolysis Bypass) GAP GAP (12) NAD GAPC 5.56 NADH NADP+ H2O (1) NP-GAPDH 1,3-bPGA 0.09 (4) NADPH + 2H+ ADP PGK 0.96 ATP 3-PGA 3-PGA Figure S2. Characterization of glyceraldehyde 3-phosphate dehydrogenase reactions in castor seeds. Expression profiles show the relative abundance (left) and number of identified proteins (top).

More Related