Download
1 / 36
370 likes | 527 Views
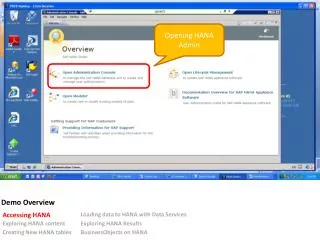
Demo Overview. Overview TComm and the files used to create a test program. Fault grade counter vectors, then rerun aatg for complete coverage Enter a functional failure in the Counter vectors. Shmoo the LatDemo DPS vs TPD WinChar the LatDemo I/V and ICC vs Fmax. TComm Overview.

E N D
Demo Overview • Overview TComm and the files used to create a test program. • Fault grade counter vectors, then rerun aatg for complete coverage Enter a functional failure in the Counter vectors. • Shmoo the LatDemo DPS vs TPD • WinChar the LatDemo I/V and ICC vs Fmax
TComm Overview • Start Tcomm by a lightning bolt icon or through the start -> programs->TComm. • If you are starting a new project select File -> New and follow the instuctions given by the Project Wizard. Else you can open a recent file by selecting File->Recent Project-> Selected Project. • You will see the project files appear in the Project box. Select the Load Project Icon. Now all of the test programs will appear in the Test List. • Click the Execute test list button in the Controls window and all of the tests are run
Execute Counter Program • At this point TComm should be running. Select File -> Recent Project->Counter.tcp. • Click on the load icon and the test list will load. • Click on the Execute test list button (highlighted in the picture) in the Control window and all tests should pass (as shown by the green check mark). • The following page shows the Tcomm Environment.
Datalog • Click on the Datalog icon bar and select pass/fail, the datalog manager will open. • Rerun the test list and all of the tests will be data logged. • Click on the arrows under test in the Datalog Manager to view each of the tests. • To configure the parameters in the Datalog Manager, right click in the view window and select Configure. The dialog box shown will appear. Select the desired parameters. • To rearrange the parameters in the view window, click and hold on the parameter and drag it to the desired location.
Project Files • ViewCode-When clicked will open the selected file. • Add file to project- When clicked will open a dialog box to add a file. • Remove file from project- When clicked will remove the selected file. • Open a Non-Project- When clicked will open a dialog box to select a file to open. • Decompile CBV- When clicked will convert file to the vct format.
Test Program Files • A Test Project contains the following four files: 1) A Pin to Channel File (.p2c) • Maps the device pins to the test system channels and power supplies 2) A Vector Source File (.VCT) or Configurable Vector File (.CVF) • Contains digital pattern data applied to the device for testing • Contains timing information for testing AC measurements • Contains clocking information • Contains load information • Contains micro instruction information (jumps, loops, repeats, conditional branches, sync).
Test Program Files 3) A Test Source File (.TS) • Contains list of desired tests • Contains part programming information if needed • Contains device parameters 4)A Pin Definition File (.def) • Contains pin names/numbers and grouping information
Creating a Test Program • There are different ways to create a test program for TComm. Here is a summary of the most common ways with details to follow: • Using APT500 with Acugen options • Using APT500 with Testgen option (this is used for VHDL and Verilog simulator output) • Translating a GR1732 program or a LMA program • Creating one from scratch
Fault coverage on Hand Generated Vectors • The counter.lis file shown states the fault coverage on 25 vectors I generated for a 24 bit counter. • To generate this file follow the steps on the next page. (If you are using your own computer, you must have Acugen installed on it for this part of the demonstration to work.)
Generating a Fault Coverage Report 1. Open a DOS box and type aalat counter.sim on the command line and press the enter key. 2. Open the counter.jdd file and add your hand generated or simulator generated vectors, making sure they are in the same pin order as the pin order at the top of the file. Save as counter.jwv and close the file. 3. Type aatg at the command line and the aatg screen will come up in the DOS box. Set the fault detection to 1% and exit from the screen. 4. Type aatg all latcounter counter.jwv and press the enter key. 5. Open the counter.lis file and scroll down until you find the fault detection information. 6. To create vectors to get closer to 100% detection, type aatg on the command line and press the enter key. Change the 1% by fault detection to 100% and go to the exit. 7. Type aatg gen on the command line and press the enter key. Open the counter.lis file to see the new fault detection.
Run Acugen • This report is the result after running atgen gen to generate the rest of the vectors needed to get full coverage of the design.
Counter Files • The next part of the demo contains instruction on how to take Verilog or VHDL simulation vector output to create a test program and how to create a test program from scratch. Both use a 24-bit counter and a Lattice 5256VE 272 pin part.
Testgen Verilog Simulator Output Demo • Testgen is a good tool to use when you have a vector source. The vector source can come from Verilog or VHDL simulation tools. For this tutorial, we will be using a vector source that came from Silos 3. Any vector source that shows 1’s and 0’s for drive states and L’s and H’s for receive states can be used. For this demo, we will be using the following files: • stim.out • 5256VE1.lat (this should be located in the ‘Apt500\standard\lat’ directory). • 56ve272b.p2c (this should be located in the ‘Apt500\P2c’ directory • Once these are in place, follow the steps on the next pages.
Testgen(Verilog Simulation Output) Demo • Open the stim.out file and erase or comment out the header information and erase the step numbers located to the side. (See Verilog Simulator Output File) • Enter the vformat statement with the pin names in the order they are in the stim file. This information will need to be provided by the designer. For this demonstration, the information is located in the vec.v file next to the sto pro statement. Save this file as a .cvf file. The pin definitions also need to be put in the .cvf file. These can be found in the counter.rpt file provided by the Lattice software. The .cvf file should now look like the Testgen Ready CVF file. • Start Apt500 and select File -> New Setup • Select Project Name (counter) and browse to the folder the above mentioned files are located. Click Next. • Select JEDEC and click Next. • Select LMO500 Test generation(TESTGEN). Click Next.
Testgen (Verilog Simulation Output) Demo • Click on the browse button and select all files next to the Files of type. Select the counter.cvf file and click open. Click Next. • Select Standard and Lattice and click Next. • Click the browse button and select 5256ve1.lat. Click Next. • Click the Finish button. • The Apt500 form should now be filled out. Select Option->TESTGEN and change the input file type from BIN to CVF. Click OK • Click the Start button. • TESTGEN will run and you will end up with a .def file, .ts file and a .vct file and a .tp file. You can now either load the test program or create a test project..
Pin to Channel File .p2c • This is a pin to channel file. It is the file that tells the software which pins go to which channels of the tester. • This is the basic template for all pin to channel files and will be provided by us when we produce the DUT cards along with an eprom that contains the deskew calibration information.
Pin Definition File (.def) • Shown is the first part of the pin definition file. The format is: • Pin [pin name][pin type][pin number]; • In this case, the pin numbers B1, C1 etc. are BGA alphanumeric row and column pin numbers • The channel numbers are commented out.
Pin Definition File (.def) • Shown is an example of a Pin Group. The group name can be used in the test source instead of typing out the whole list. The format is: • PinGroup [group name][included pins];
Test Source File (.ts) • This is the beginning of the test source file. It must include the following: #include name.p2c, #include name.def DPS_TURN_ON_SEQUENCE (name…) LoadVPU (“filename.cbv”, pattern name); LoadScan (“name.svf”, pattern name); The default values are a choice. If you are going to keep the values the same throughout the tests then it’s a good idea to place them here.
Test Source File (.ts) • The Boundary Scan Information only needs to be present if using the boundary scan for testing or for programming. • The rest shows 2 examples of tests. They include a test label, a test call and the parameters desired for the test.
Test Source File (.ts) • This shows more test examples and the scan programming call. • The jtagpgm() function uses the name that was assigned in the LoadSCAN function. In this case it was PgmPat.
Test Source File (.ts) • This clip shows that multiple programming and vector files can be loaded in a single test program. Later when testing just use the program name to reference the program or vector file desired. For example: //----- FUNCTIONAL 1 Pgm_Nom_Fun1: jtagpgm() { ExecScan_Test (PgmFun1); } Func_Max_Fun1: Functional () { DPS_Force[1] = 3.6 V; DPS_Force[2] = 3.6 V; Pass_Bin = 1; Fail_Bin = 7; ExecVPU_Test (VecFun1); }
Configurable Vector File (.cvf) • Shown is an example of the first part of a cvf file. It must include the include statement for the pin definition file and the vFormat statement, which defines the pin order of the vectors. • The first vector is an ICC vector. bIccTst: is a label that is used in the .ts file. The next line is a vector and the next line contains a ;halt microinstruction.
Configurable Vector File (.cvf) • Shown here is a vector set which floats a one across the outputs by floating a one across the inputs and loading it.
Vector Source File (.vct) • Shown here is a snippet of a .vct file. This file can be generated from a .cvf by going into the project window and clicking on the decompile .cbv file.
BSDL & SVF Files • TComm and the LMO500 also require a BSDL file and an SVF file in order to program a part. The BSDL file is used by our programming card to identify the jtag pins and the setup of the part. The svf file is used to program the design into the part. The BSDL file can be obtained from the device vendor and the svf file from the vendors software. In some fpga’s the vendors do not use svf files, in the case of the Xilinx fpga’s we use the bit file to program them.
Functional Failure To induce a functional failure, change the H to an L in vector 16. You do this by opening the cvf file, going to vector 16 and writing over the H with an L. Now reload the test program and the error will be compiled. Turn on the Datalog Manager and execute the test list. The functional failure will show up in the datalog.
Shmoo LatDemo • We have now switched from the Counter program to the LatDemo program. • This example shows how to run a shmoo from within a .ts file. The shmoo is tpd vs dps1. The tpd is set from 8ns to 20ns and the Dps1 is set from 1.5V to 4 V. The following page shows the results.
Shmoo LatDemo • Here are the results of the shmoo. This is set to show FFV (First Failed Vector). When running from the .ts it will first show just pass and fails. You then go to the Plot -> properties -> options and click on FFV. • The different colors represent which vector failed first with the plotted parameters.
WinChar LatDemo I/V • This example uses the LatDemo program and the VOH test.
WinChar LatDemo ICCvsFmax • This example uses the LatDemo program with the ICC Test. This test clocks from 1Mhz to 100Mhz and shows the effects on ICC.