Download
1 / 22
220 likes | 322 Views
Assessment of regional climate vulnerability in Germany and the policy science interaction. Jürgen P. Kropp Potsdam Institute for Climate Impact Research (PIK) Head North-South Theme (www.pik-potsdam.de/nsp).

E N D
Assessment of regional climate vulnerability in Germany and the policy science interaction Jürgen P. Kropp Potsdam Institute for Climate Impact Research (PIK) Head North-South Theme (www.pik-potsdam.de/nsp) Team: M. Lüdeke, D. Reckien, H. Förster, T. Grothmann, L. Costa, T. Sterzel, O. Roithmeyer, A. Holsten, M. , C. Walther, V. Tekken, T. Lissner, S. Ritchie, T. Weiss, C. Pape, M. Moneo, D. Rybski, I. Niemeyer, M. Wrobel, O. Kit, M. Budde, S. Hofmann, N. Lux, S. Kriewald, J. Kossak, N. Protze, M. Böttle, P. Pradhan, J. Briganti, M. Röse, S. Fabri, R. Moreaux, M. Röse
Peaking of Emission beyond 2020: > 1x Kyoto/yr 2Gt/cap/yr! 0.1 Gt/cap yr Poorest 35 27 Gt/cap yr US 2° Temperature guardrail: 2 °C - 2100, < 0.2°C/yr Actual +0.8 °C, at least 0.4 °C in the “pipeline” 0.2 °C we have approx. approached! „Negative Emissions“ Source: after Meinshausen et al. 2009/PIK
What are the difficulties? • Science and policy/decision makers have different “styles of thinking”: • Science is interested in systematic analysis of mechanisms and functions, or in other words science seeks for the “thruth” • Policy/decision makers are interested in concrete problem solving and do not want too much about the background • “Climate Change” is increasingly misused for labeling of anyway necessary action • Science cannot (yet) solve problems and political aims of policy makers, we can make rough suggestions. • Impact analyses are hardly comparable, cause institution use different scenarios
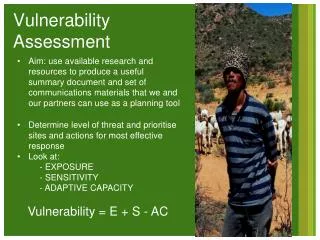
Cities Rivers Admin. districts Height (in m) Example: North-Rhine Westphalia 22 % (18 Mio.) of total population of Germany 26 % forests, 50 % agriculture Ca. ¼ GDP 4 PIK-Studies: NRW I Study (1998-1999) Regional climate scenarios NRW (2004-2006) NRWII Study (2008-2009) ESPON-CLIMATE case study (2008-2011)
Integrated Vulnerability: NRW I (1998) Kropp et al. 2006, Climatic Change 396 communities 24 indicators society economy tourism ecosystems Insufficient, cause sectoral focus is not visible, no cause effect chain, etc. Retrieval for methods Source: Kroppet al. 2006, Climatic Change
Sectorale Vulnerability 1999 Stimulus:storms Exposed unit: forestry; Indicators: tree types, slope, relative Strom frequency Actual damage 2007 > 19 Mio m3 Source: Kropp et al. 2006, Climatic Change
Regional Distribution of Functional City Types North-Rhine Westphalia 18 m residents, 34.000 km2, 397 communities, 25% GDP Neuronal Network Approach, 24 input variables (Source: Kropp et al. 2006/PIK) #1: Industrial Centres (mainly Rhine-Ruhr basin) #2: Recreation Regions #13: Suburbs and Low Diversified Cities #24: Rural Communities Kropp et al. 2006, Climatic Change
Deterministic and sectoral, by review of literature, and “distillation” of relevant mechanism,in particular, what are the drivers of risk!
Inclusion of climate scenarios in sectoral approaches Mandatory: Comparison cf. models scenarios, e.g. CCLM/STAR for NRW z.B. Annual mean T: C-CLM is too cold! (A1B) Source: Kropp , Holsten et al. 2009
Health Risk related to heat waves(time demand 6 man month) Heatwaves • Increase in number and duration of heatwaves (CCLM, scenario A1B) • Densely populated areas, in particular in the Rhine-Ruhr basin and in the large cities alog the river rhine, cause number and temperature could become very high. Example Rhine valley/ Cologne Bight: Amount of heatwaves Duration in days Source: Kropp , Holsten et al. 2009
Health Risks in Urban Agglomerations Health Risk - Vulnerability • Comparative analysis by an indicator-based fuzzy model • e.g. sealed surface, amount of elderly people, demographic & regional scenarios,... • will become not only for densely populated areas a problem Vulnerability a), b) Change Very small Small Medium High Very high Change Unch. Slight change Medium change high change Very high change Source: Lissner & Kropp 2008
Storm risk Topography Tree types Risk category No data Very low Low Medium High Very high Analysis of mechanisms, e.g. what are the determinants of risk? time demand 3.5 man month Change of storm days % Soil types Strom frequency corniferous mixed deciduous Source: Kropp , Klaus, Holsten 2008
Transpiration run-off mm/yr Once again: climate related drivers(time demand 4 man month) groundwater recoverage mm/yr Precipitation from here input for other questions, e.g. cooling demand for power plants….
River Weser/Intschede Climatic water balance summer CCLM: too humid
Climatological: fire risk(time demand 4 man month) Longer and more! Days with high fire risk
Change in seasonality Shift to summer, but is there really a risk? Source: Costa, Kropp , Holsten 2008
Putting the things together integrating climate risk, settlement distribution, land use, etc…. Source: Costa, Kropp , Holsten 2008
A compromise: Cause effect chains are useful for the analysis of the effects of adaptation effects Is stimulus related, but needs time, cause “networks and interlinkages” have to be defined inundation damages to traffic infrastr. damages to buildings damages to power grids traffic breakdown Clearly allows to identify how an stimulus and/or impact(s) will propagate through a system or how influential adaptation could be! Source: Kropp & Reckien 2009
seek here for responses to risk regional propagationmechanisms! … and than perform economic analyses!
Broadening of science/stakeholder interface: clear target definition, e.g. of what is wanted, which questions should be answered Fuzzy definitions of tasks may lead finally to frustration on stakeholder’s side Do not underestimate the time demand Clearly define mechanisms jointly for vulnerability analyses Regarding adaptation Cannot finally discussed by science, decision maker’s bias is too large! I prefer that science should solve academicquestions related to adaptation (there are still enough!) Implications/Conclusions
Ongoing & future activities CI:grasp: Climate Impacts: global & regional adaptation support platform (running, Focus developing countries, two institutions PIK/GTZ, 1.8m) PROGRESS (fall 2009 – four years, 4(+4) partners, 11m, BMBF), Potsdam Research Cluster on Georisk Analysis, Environmental Change, and Sustainability, worldwide with specific foci, coordinator: University of Potsdam MEDIATION: Methodology for Effective Decision-making on Impacts and Adaptation (11 Partners, beginning 2010, 3.5 years, coordinator : Alterra, 7 FRP, 3m , Focus: Europe)