1 / 1

กราฟแสดงระดับและปริมาณน้ำ ของอ่างเก็บน้ำลำปาว

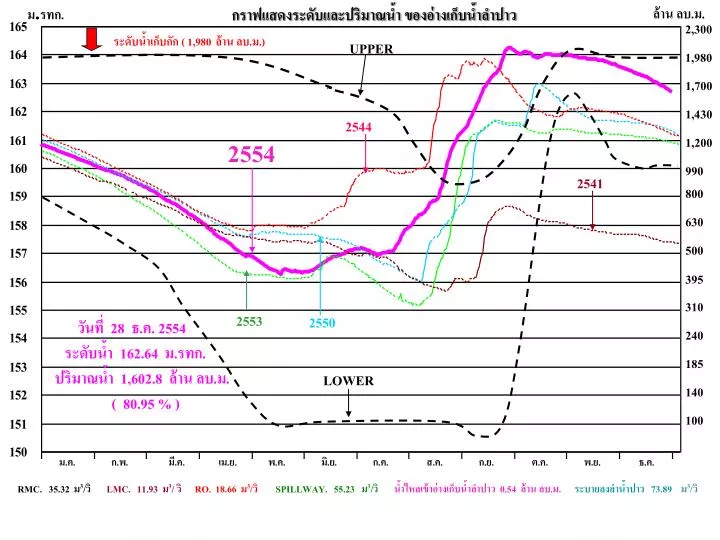
ม . รทก. กราฟแสดงระดับและปริมาณน้ำ ของอ่างเก็บน้ำลำปาว. ล้าน ลบ.ม. 2 ,300. ระดับน้ำเก็บกัก ( 1,980 ล้าน ลบ.ม.). UPPER. 1 ,980. 1,700. 1,430. 2544. 2554. 1,200. 990. 2541. 800. 630. 500. 395. 310. วันที่ 28 ธ.ค. 2554

dobry
Download Presentation

กราฟแสดงระดับและปริมาณน้ำ ของอ่างเก็บน้ำลำปาว

An Image/Link below is provided (as is) to download presentation Download Policy: Content on the Website is provided to you AS IS for your information and personal use and may not be sold / licensed / shared on other websites without getting consent from its author. Content is provided to you AS IS for your information and personal use only. Download presentation by click this link. While downloading, if for some reason you are not able to download a presentation, the publisher may have deleted the file from their server. During download, if you can't get a presentation, the file might be deleted by the publisher.

E N D

Presentation Transcript


  1. ม.รทก. กราฟแสดงระดับและปริมาณน้ำ ของอ่างเก็บน้ำลำปาว ล้าน ลบ.ม. 2,300 ระดับน้ำเก็บกัก ( 1,980ล้าน ลบ.ม.) UPPER 1,980 1,700 1,430 2544 2554 1,200 990 2541 800 630 500 395 310 วันที่ 28 ธ.ค. 2554 ระดับน้ำ 162.64 ม.รทก. ปริมาณน้ำ 1,602.8 ล้าน ลบ.ม. ( 80.95 % ) 2553 2550 240 185 LOWER 140 100 ม.ค. ก.พ. มี.ค. เม.ย. พ.ค. มิ.ย. ก.ค. ส.ค. ก.ย. ต.ค. พ.ย. ธ.ค. RMC. 35.32 ม3/วิ LMC. 11.93 ม3/ วิ RO. 18.66 ม3/วิSPILLWAY. 55.23 ม3/วิน้ำไหลเข้าอ่างเก็บน้ำลำปาว 0.54 ล้าน ลบ.ม.ระบายลงลำน้ำปาว73.89 ม3/วิ

More Related