Download
1 / 19
190 likes | 196 Views
This study aims to compare and evaluate different monitoring strategies used by Member States in the CMA guidance document, assessing their effectiveness and cost-benefit. Simulated "virtual" data based on real data from Burana-Po di Volano and Sacca di Goro will be used. The study will also involve analyzing geographical, hydrographical, geomorphological, land-use, climatic, and pressure data. Phase II will involve test experimental details and collaborative field trials.

E N D
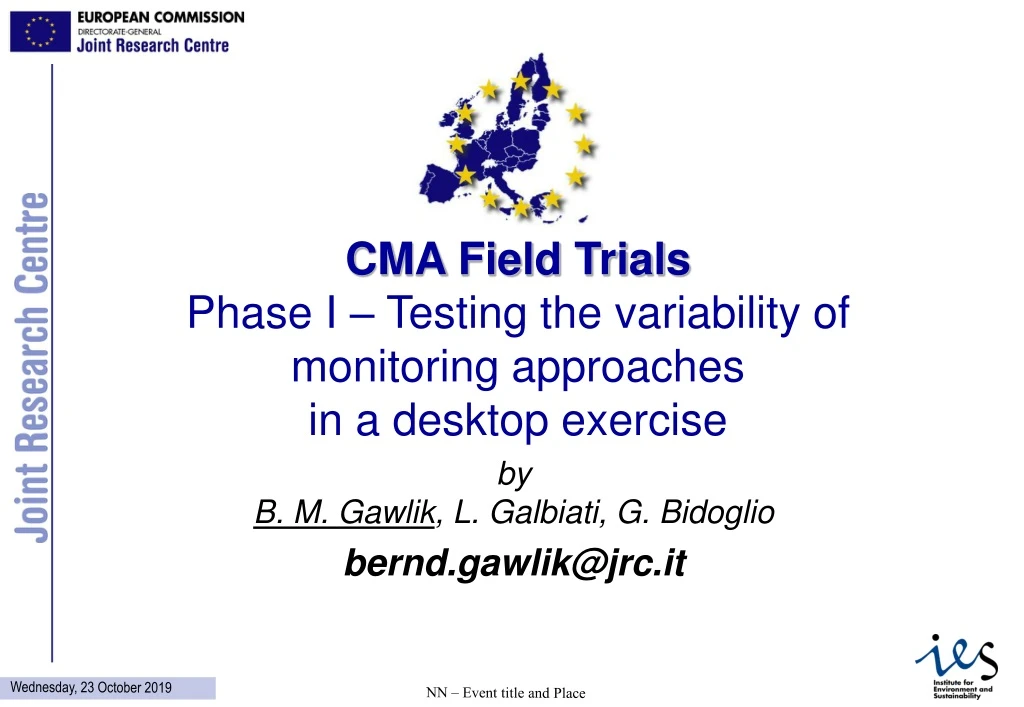
CMA Field TrialsPhase I – Testing the variability of monitoring approachesin a desktop exercise byB. M. Gawlik, L. Galbiati, G. Bidoglio bernd.gawlik@jrc.it NN – Event title and Place
Context and Background • WATER FRAMEWORK DIRECTIVE 2000/60/EC; • Expert Group on Analysis and Monitoring of Priority Substances to the Water Framework Directive Expert Advisory Forum on Priority Substances and Pollution Control; • Implementing Directive 2000/60/EC concerning minimum performance criteria for chemical monitoring methods and the quality of analytical results (in preparation); • CMA (Surface and Marine Waters, Groundwater)
The idea of Phase I • to compare different possible monitoring strategies used by Member States and identified in the CMA guidance document. • to evaluate the effectiveness and cost-benefit of the different monitoring strategies as proposed by the partners in the exercise (CMA/PRB volunteers). • to assess expectable variability of results caused by the monitoring strategy. • Use simulated “virtual” data pool based on real data
BURANA-PO DI VOLANO and SACCA DI GORO: • Particularly important because: • Intensively cultivated, • The nutrients applied within the watershed quickly move from the basin to the coastal zone, • The Sacca di Goro lagoon is of a great importance both for ecological and economical reasons, • This watershed allows the evaluation and application of tool for the Integrated River Basin Management Plan.
Geographical The 50m x50m cell digital elevation model; Geographical map with appropriate reference to co-ordinates; Hydrography Map of the channel network in the watershed; Six time series about the aquifer trends in the watershed for the period 1996- 1998 on a monthly basis.; Information on fluxes on main outlets of the channel network; Geo-morphological The 50m x50m cell size soil distribution; Soil textural descriptions; Short description hydrogeological parameters; Land-use The 50m x50m cell land use map; Generic information on agricultural management practice; Climatic conditions Location and data about daily precipitation and temperature (max and min), in 6 stations distributed in the whole watershed, period 1990 – 1999; Pressures Generic data on water quality such as typical values of nutrients, heavy metals, sum parameters, POPs, etc; Information about Principal point sources; Phase I - Dossier
Burana-Po di Volano (BP-V) watershed is covering an area of around 3000 km2. • It is a complex system, especially for what concerning the river network • Artificial channels • Water is moved using pumps • Direction of water in many channels is opposite respect with to the slope.
INPUT for ISSm (Integrated Surface and Subsurface model). • Daily precipitation and max/min temperature, • grids maps about soil, landuse and digital elevation model, • Data about the management of water within the basin, description of the channels and water pumps, amount of water derived for irrigational purposes, • Description of the soil types, • Time series of water flow and measured data about the water quality along the channel network to be used in the calibration of the model, • Soil water content and diluted nutrients, • Crop rotation, crop management operation schedules, • Time series about the groundwater table trends.
The Consorzio di Bonifica I° Circondario (CB-1C), • Il CB-1C covers an area of around 900 km2, • Intensively drained by rivers and artificial channels (around 1500 Km of channels extension), • Parts of the channels (400 Km) have draining purposes, another part have irrigational purposes (350 Km), the remaining part have a mixed use (800 Km).
Channels network description and location of measured station:
Groundwater trends: 1999-2001 E=0.713 E=0.668 E=0.693
Water flow at the system outlets: Collettore Acque alte & Collettore Acque Basse 1991-2001
Mineral P Kg/month Station 611 Po di Volano vs. Simulated. No3 Kg/months Station 611 Po di Volano vs. Simulated. E=0.533 E=0.611 Nutrients loads to the Sacca di Goro lagoon, 1991-1998
Phase II • Test experimental details of the various guidance documents; • Collaborative field trials as feasibility phase; • Reference laboratory network to eliminate interlaboratory variations; • Preparation of longer lasting project in the context of FWP VII.