Download

1 / 53
530 likes | 534 Views
Snohomish PUD Tidal Power Project. Mitsuhiro Kawase and Dmitri Leonov School of Oceanography Brian Polagye Mechanical Engineering. November 14, 2007. Agenda. Tidal Currents in Puget Sound Current Measurements in Admiralty Inlet Numerical Modeling of Deception Pass. Moon. A. C.

E N D
Snohomish PUD Tidal Power Project Mitsuhiro Kawase and Dmitri Leonov School of Oceanography Brian Polagye Mechanical Engineering November 14, 2007
Agenda • Tidal Currents in Puget Sound • Current Measurements in Admiralty Inlet • Numerical Modeling of Deception Pass
Moon A C Centrifugal Force A’ Center of Mass C’ Earth
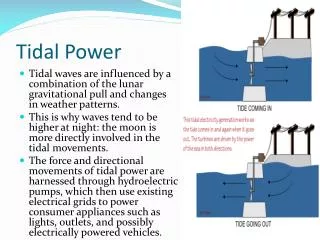
Centrifugal Force Moon’s Gravity TGF TGF Gravity weaker In balance Gravity stronger Moon Earth Origin of the Semi-diurnal Tide
Tide-Generating Force around the Earth This is a hypothetical case exaggerated to show the direction of TGF. (Moon mass is 2/3 of earth mass and moon is at 5 earth radii away)
Tide in Puget Sound Tidal height (in meters) over a four-day period in February, 2006 in Elliott Bay, downtown Seattle: From http://tbone.biol.sc.edu/tide/sites_uswest.html Tidal variation of sea surface is not regular; there are periods in which once-a-day, rather than twice-a-day, variability dominates.
Earth’s Rotation Axis In balance, no TGF Gravity stronger TGF Moon Origin of the Diurnal Tide
Semi-diurnal, Diurnal, and Mixed Tides From http://www.physicalgeography.net/fundamentals/8r.html
Neap Tide - Lunar and Solar TGFs even out Lunar TGF Spring Tide - Lunar and Solar TGFs combine Solar TGF The Spring-Neap Cycle
Pole Rotation axis oriented 90º to the moon - minimum diurnal tide Rotation axis oriented to the moon - maximum diurnal tide Viewed from above the orbital plane The Lunar Declination Cycle TGF
Puget Sound, Washington • Southernmost fjord of Pacific North America • Deep (max. 283m) • Connected remotely to the Pacific via Strait of Juan deFuca • Stratified basins interspersed with vigorous, localized tidal mixing • Hypoxia in end basins
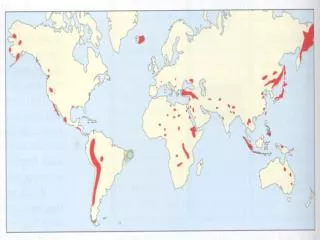
Occupy high-latitude coastlines of the subpolar gyres of the world ocean Complex morphology and bathymetry, with deep basins connected through constrictions Important habitat of marine organisms that form significant fisheries resources Relatively unexplored except for those close to large population centers Fjords – Coastal Inlets formed by past glaciation
Schematic of exchange circulation in a fjord (cross-section) River Input (Fresh, Light) Strong Tidal Current Outflow Tidal Mixing Sharp Pycnocline Main Basin Marine influence (Salty, Dense) Inflow/Reflux Entrance Sill
12 12 10 10 June 8 8 Dalco Passage Admiralty Inlet Sills Main Basin SJDF December Black line: Last contiguous density surface across Admiralty Inlet Potential Temperature 1999
Tidal Energy Flux in Puget Sound (in Megawatts) • From Lavelle et al. 1988 • Most of the energy dissipation happens in the sill region: • 71% of 733 MW that comes into Puget Sound is dissipated over the Admiralty Inlet sills. • 59% of 133 MW that goes into the South Sound complex is dissipated over Tacoma Narrows. • Large interior basins, such as the Main Basin, Hood Canal and Whidbey Basin do relatively small part of dissipation (11% for the three basins combined) 733 30 16.5 166 133 55
RMS Current Speed (left) and Energy Extraction Potential (right)
Main connection between Puget Sound basins and the Pacific Ocean via Strait of Juan de Fuca Double-silled channel Strong tidal currents of up to 3 meters per second Strong internal variability of the water column Admiralty Inlet
Admiralty Inlet Skagit River Strait of Juan de Fuca Stillaguamish River Port Townsend Whidbey Basin Admiralty Inlet Whidbey Island Snohomish River Possession Sound Edmonds Kingston Kitsap Peninsula
Major Ebb Headland Eddy
Slack Tide Note: Tidal current reverses on the Olympic side first
Minor Ebb Note: Headland eddy does not form during minor ebb
Major Flood Headland Eddies
A direct, very narrow (~120m) connection between the head of Skagit Bay and Strait of Juan de Fuca Very strong tidal currents up to 4 meters per second Water column likely well-mixed during strong currents An unknown fraction of Skagit River water exits through the channel to the Strait Deception Pass
Tides are the major suppliers of mechanical energy into estuaries. This mechanical energy drives many of the processes that operate in the estuary such as: Transport of material by tidal currents; Generation of turbulence and mixing, which mixes the sea water and the river water, and in turn drives the circulation that flushes the estuary; Wetting and drying of tidal flats. Thus, tidal energy flux is one of the fundamental parameters that needs be ascertained for an estuary. Why Concerned about Tidal Energy Flux and Dissipation?
Agenda • Tidal Currents in Puget Sound • Current Measurements in Admiralty Inlet • Numerical Modeling of Deception Pass
Characterizing Tidal Currents in Admiralty Inlet • Preliminary characterization: • Historical current measurements (1940’s – 1970’s) • NOAA tidal current predictions (based on historical measurements) • Indications of locally strong currents (hot spot) Point Wilson Admiralty Head Admiralty Head Marrowstone Point • Goals of on-site measurements: • Verify NOAA current predictions • Extrapolate findings to annual basis Point Wilson
Survey Plan • All surveys carried out under contract by Evans-Hamilton, Inc. using Acoustic Doppler Current Profilers (ADCP) • Two types of surveys: • Over-the-side (OTS) with ADCP mounted on boat traversing inlet (spatial series, ~ constant time) • Stationary with ADCP anchored to bottom (time series, constant spatial) • Timeline: • OTS Round 1: July 30-31 • Stationary Deployment: August 18 • OTS Round 2: August 27-28 • Stationary Recovery: September 19 Round 1 OTS Round 2 OTS Stationary Admiralty Head Point Wilson
OTS OTS Results - Depth-averaged Speed - Speed (m/s)
OTS OTS Results - Corrected Depth-averaged Power Density - • A number of adjustments made to raw data • Convert to power density • ½ x density x (velocity)3 (kW/m2) • Power density is relevant metric for kinetic power extraction • Crude correction for cycle time • Adjust measurements to cycle peak using timing of NOAA predictions • Exclude measurements more than 1.5 km from a NOAA prediction • Exclude measurements where power density estimated less than 40% of cycle peak Power Density (kW/m2)
Flood tide, prior to peak (15:15) OTS OTS Transect Direction of Travel 12:44 13:14
Flood tide, near peak (14:00) OTS OTS Transect Direction of Travel 14:01 14:30
Stationary Current Ellipses - 60m off Seabed, 85m ADCP Deployment - Principle axis
Stationary HAMELS Analysis • HAMELS (Harmonic Analysis MEthod of Least Squares) is a mathematical technique used to model underlying lunar and solar forcing • Forcing generally of the form: • ωjare frequencies of solar and lunar tidal constituents and known in advance • Rjand φj are the magnitude and phase lag of the forcing, respectively, and must satisfy: • T_TIDE package (Pawlowicz et al. 2002) used to perform analysis • Statistical analysis used to determine significant constituents (m) • Modified package to rotate ellipse onto principle axis prior to HAMELS analysis • Once magnitude and phase of forcing determined, predictions of the tidal currents can be made for past and future times
Stationary Sample Harmonic Prediction Velocity (cm/s) Result is for one ADCP depth “bin”. Repeat for all other bins.
Stationary Annual Average Power Density - 65m ADCP Deployment -
Stationary Annual Average Power Density - 85m ADCP Deployment -
Conclusions • OTS ADCP surveys indicate: • Strong currents in central Admiralty Inlet • Bathymetry influences currents • Stationary ADCP surveys indicate: • Area of strong currents has a relatively high annual average power density, but there is considerable variation within the region • In combination, the ADCP surveys have: • Demonstrated that the Admiralty Inlet in-stream resource is substantial and warrants further investigation • Indicated the need for detailed numerical modeling to characterize the resource for a large array • Indicated that NOAA tidal current predictions are not uniformly accurate
Agenda • Tidal Currents in Puget Sound • Current Measurements in Admiralty Inlet • Numerical Modeling of Deception Pass
Deception Pass Model Domain and Bathymetry
Deception Pass Model Grid 52000 horizontal nodes, 15 vertical levels
Tidal elevation from PRISM (POM) model along each open boundaries 3 days during spring tide (Nov. 2004) Forcing
Entire Domain Sea surface height (color), current (vector)
Deception Pass Channel Flow speed (color), velocity (vector): 10km scale
Deception Pass Channel Flow speed (color), velocity (vector): 4km scale
Power Density Kinetic energy fluxper unit area: 1/2 |v|3