Download
1 / 23
230 likes | 235 Views
Cold dust in supernovae: the elephant in the room?. Loretta Dunne. Haley Gomez, Rob Ivison, Steve Eales, Steve Maddox, Larry Rudnick, Brenda Matthews, Tracy DeLaney, Chris Crowe, Simon Dye. Supernovae as dust factories?.

E N D
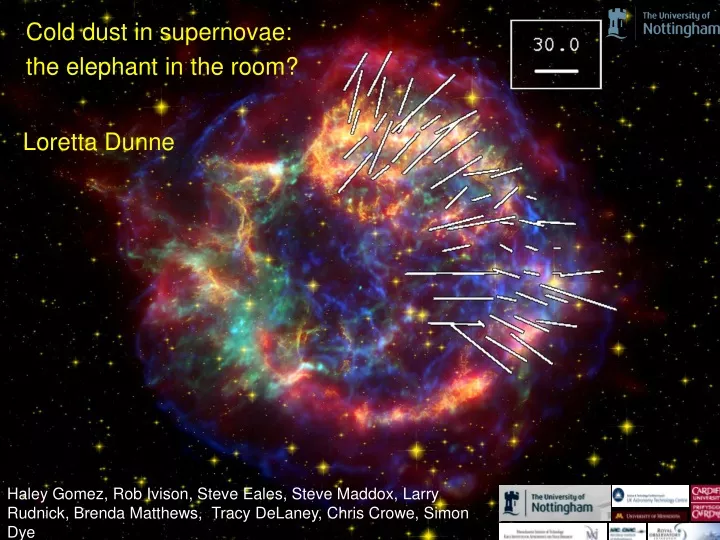
Cold dust in supernovae: the elephant in the room? Loretta Dunne Haley Gomez, Rob Ivison, Steve Eales, Steve Maddox, Larry Rudnick, Brenda Matthews, Tracy DeLaney, Chris Crowe, Simon Dye
Supernovae as dust factories? Huge masses of dust now seen in QSOs at z > 5 (Priddey et al. 2008; Wang et al. 2008; Bertoldi et al. 2003) Sub-mm implies 108 – 109 M8 dust has formed in < 1 Gyr A rapid dust source is required to produce the high-z dust (Morgan & Edmunds 2003; Dwek 2007 but see also Valiante et al. 2009) In theory SNe can produce ~ solar mass quantities of dust on short time-scales. Kozasa 91, TF01, WW 95, Nozawa 03; Bianchi & Schneider 2007 Dust destruction also important, how much survives the reverse shock? (Nozawa et al. 2007 (size dependent); Bianchi & Schneider 2007; Williams et al 2006; ) z=5.74 QSO at 850mm with SCUBA (Priddey et al. 2008)
Optical/IR observations of new dust forming require assumptions about geometry and optical depth which introduce large uncertainties on mass of dust Mid-IR observations sensitive only to warm dust at T > 40 K. Inclusion of 70 mic data for Cas A led to an order of magnitude increase in inferred mass of dust (Rho et al. 2008) Solution: observe at longer wavelengths to probe colder dust if present. SNe dust – observational evidence • Evidence for dust formation in many SNe and remnants • Dust begins to form ~100 days or so after the explosion. • Implied masses are 10-5 – 0.05 Msun • (Lucy 89,91; Sugarman 06, Meikle 07; Smith 08;Lagage 96; Rho 08; Blair 07; Borkowski 06)
Cas A at 850mm Scan-mapped a 10’ x 10’ field at 450/850mm with SCUBA Found sub-mm emission in excess of that extrapolated from synchrotron Dunne et al. 2003 Nature, 424, 285
IR – Radio SED of Cas A I I I S S I
Synchrotron Subtraction • Synchrotron is convolved to same resolution as 850 micron and scaled using a spectral index map • Scaled synchrotron image is subtracted from sub-mm image, residual is dust emission
Cold dust in Cas A? A synchrotron subtracted sub-mm image of Cas A shows residual emission from cold dust at ~ 20 K (Dunne et al. 2003; 09) Rings show forward and reverse shocks (from X-ray Gotthelf 01) Dust in denser regions behind shocks, similar to X-ray emission.
12 10 8 6 4 2 0 6 4 2 0 Signal-to-noise cold dust Signal-to-noise dust + synchrotron Kepler’s remnant also shows excess sub-mm emission over synchrotron Morgan et al 2003; Gomez et al., 2009
Biggest uncertainty is k - diffuse ISM ( ) nebulae, evolved stars ( ) amorphous/agglom in lab ( ) How much dust is there ? Estimate dust mass from submm flux As most mass in cold component, Td = 18 K Mass ranges from 2-20 Msun for Cas A, larger k give most plausible dust masses ~ 2-3 M8 For Kepler the dust masses are 0.1 - 1 Msun, for the same range of k
Krause et al 04; Their synchrotron subtracted map with contours of OH in absorption against the bright radio continuum of Cas A New synch subtracted map (using spectral index map) overlaid with contours of CO(2-1) Contamination by foreground clouds • Foreground molecular clouds contribute to the submm emission - dust masses over-estimated. (Krause 04; Wilson & Batrla 05, cf Gomez et al. 09)
Krause 2004 ‘median’ Dunne 2003 ‘linear’ SCUBA scan-map data can have large-scale artefacts / gradients. These can be mitigated to some extent by choices during data reduction. ‘Median’ mode used by Krause leaves large gradient and strong negative signal in North
Foreground clouds and Kepler (Gomez et al. 2009) Three faint gas clouds at v= -1, 4 and 11 km/s Optically thin in 12CO(2-1) line Faint (< 1 K) and narrow lines (< 1 km/s), column densities < 1019 cm-2 No evidence for interaction • -10 -5 0 5 10 20 30 Ta* (K) velocity (km/s) H2 column densities from CO 100 times lower than would expect if sub-mm were associated with foreground Dust mass = 0.1 -1.0 Msun (depending on kappa)
Other alternatives to cold dust • Iron needles in Cas A (Dwek 04) • Mass inferred originally conflicted with metals produced in ejecta • Hard to make ‘normal’ grains this cold in proximity to X-ray plasma • Iron needles are highly emissive in sub-mm, come into equilibrium at 8K and mass is only ~10-5 Msun • Iron needles in Kepler (Gomez et al. 05) • Using same model as Dwek 04 could not produce fits to the Kepler data. • Needles very extreme – only few atoms wide, axial ratios of 105 • Either no iron needles or properties must be very different between remnants
ISO 170 micron having subtracted a 20K background Iron Needles Dwek 2004
Polarimetry: A test for dust in Cas A • Iron needles – elongated and ferromagnetic, should produce highly polarised sub-mm emission • Foreground dust – should not be strongly polarised and alignment should not correlate with B-field in remnant
SCUBA Polarimetry of Cas A • 2 jiggle positions • Grade 1 weather in 2004 • Exceptionally stable
Fig. 1: (Left) Sub-mm polarisation vectors overlaid on the SCUBA 850 micron map [1]. Vectors are rotated by 90 degrees to show the direction of the magnetic field. (Right). 5-GHz vectors overlaid on a 5-GHz image, corrected for rotation measure. The sub-mm polarisation is a) aligned with the field of the remnant and b) much greater than that at 5-GHz Fig. 1: (Left) Sub-mm polarisation vectors overlaid on the SCUBA 850 micron map [1]. Vectors are rotated by 90 degrees to show the direction of the magnetic field. (Right). 5-GHz vectors overlaid on a 5-GHz image, corrected for rotation measure. The sub-mm polarisation is a) aligned with the field of the remnant and b) much greater than that at 5-GHz 2. Sub-mm polarimetry of Cas A 2. Sub-mm polarimetry of Cas A SCUBA polarimetry of Cas A Dunne et al. 2009, MNRAS, 394, 1307 Cas A shows much stronger polarised emission at sub-mm wavelengths compared to the radio. The direction of the sub-mm polarisation is consistent with the radial magnetic field indicated by synchrotron.
Comparison to synchrotron: I • Sub-mm pol is inconsistent with being due to synchrotron • % pol in synchrotron is at a constant level from 5 GHz – 2 micron • No known way to make it ‘peak’ in the sub-mm predicted sub-mm pol If only synchrotron is polarised measured sub-mm pol Polarization %
Comparison to Synchrotron: II Synchrotron determination of B-field direction compared to sub-mm Whatever is responsible for the extra sub-mm pol signal is related to same B-field responsible for synchrotron – INTRINSIC to the remnant
Cold dust in Cas A! This image is synchrotron subtracted 850 micron with synchrotron corrected polarisation vectors. Contours are CO emission Note there is polarised and unpolarised sub-mm emission where there is no CO On the strong CO peak, the polarised fraction decreases, consistent with some contamination of the sub-mm peak by foreground dust Estimated mass of dust is ~ 1 Msun for kappa(850) = 0.7 m2 kg-1
Unusual dust? The polarised fraction for the dust is very high (~30 % on average). This is a lower limit to the intrinsic polarisation (viewing angle, beam depolarisation) This could suggest an exotic type of dust grain – e.g. iron needles as proposed by Dwek 2004. Normal grains with modest axial ratios (1.4-1.7) can also produce this polarisation with optimal alignment and viewing conditions
Models need to address: • Sub-mm emission in SNR is not all foreground. Models of SNe dust formation should attempt to include sub-mm data in their work. • High emissivity (kappa(850) > 0.7 m2 kg-1) needed for Cas A to avoid unphysically large dust masses • Higher emissivity helps explain the colder temperature – dust then different to hot component which is well modelled by kappa(850) ~0.04 - 0.2 m2 kg-1(Nozawa 08; Bianchi 07; Rho 08) • Grains must be elongated to produce polarised emission – models currently only produce spherical grains • What is responsible for grain alignment in Cas A and can the polarimetry be produced by ‘normal’ dust ?
The future - Herschel • MESS GT Consortium; PI Gronewegen • 11.3 h PACs imaging @70, 110 and 170 um • 15.6 h PACs spectroscopy @70-210 um • 4.4 h SPIRE imaging @200, 250 and 500 um • 6 SNRs: • Kepler, Cas A, Tycho, SN1181 and Crab • dust quantity (hot + cold) • dust composition • separate SNR / CSM / ISM components