Download
1 / 7
70 likes | 74 Views
Calculating Albany Airport monthly mean temperature anomalies. Anomalies from the monthly mean climatology: Black: actual temperatures Green: climatology. depends on the month. Anomalies. m. Calculating Albany Airport monthly mean temperature anomalies.

E N D
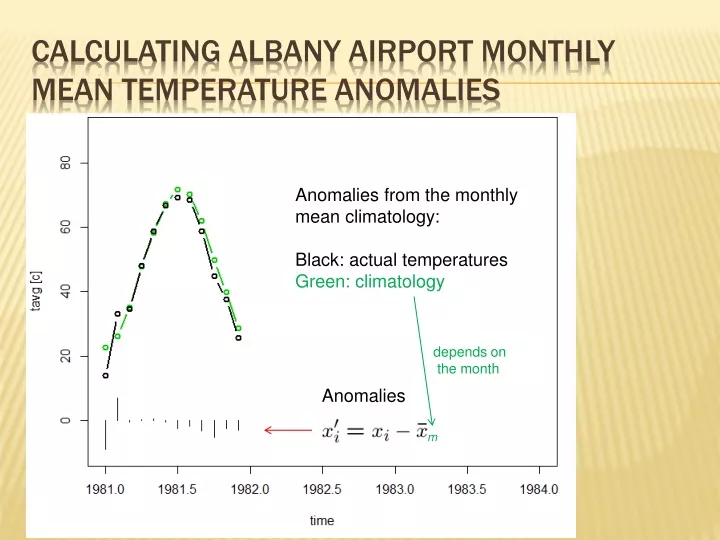
Calculating Albany Airport monthly mean temperature anomalies Anomalies from the monthly mean climatology: Black: actual temperatures Green: climatology depends on the month Anomalies m
Calculating Albany Airport monthly mean temperature anomalies Anomalies from the monthly mean climatology: Black: actual temperatures Green: climatology Anomalies
Calculating Albany Airport monthly mean temperature anomalies print(paste(“i=“,i,”, m=“,m, sep=“”)) Note: the results for Albany and Central Park NY are stored in (units for tavg are degree C!) data/USW00014735_tavg_mon_mean_ano.asc data/USW00094728_tavg_mon_mean_ano.asc
Calculating Albany Airport monthly mean temperature anomalies Note: the results for Albany and Central Park NY are stored in (units for tavg are degree C!) data/USW00014735_tavg_mon_mean_ano.asc data/USW00094728_tavg_mon_mean_ano.asc
class07.ppt (pdf): vector dot-product function • R: • scripts/ • vectorfunctions.R • myfunctions.R • climatology.R, • plot_climatology.R Updated ONLINE Course Material climatology.R is an example how to concentrate all user-interactions with the program to a few lines at the top of the program: This makes a program re-usable. Give it a try: change the station name, and the year-range of the calculation for the climatological cycle. You will find an example at the end, how to write results to a data file. plot_climatology.R is a program to plot the results. It shows you how you can read back in the created data file. Note: try these scripts and compare with our previous scripts albany_climatology.R
R: monthly mean temperature data (in degree C) • data/ • USW00014735_tavg_mon_mean_climc_1951-1980.asc • USW00014735_tavg_mon_mean_climc_1981-2010.asc • USW00094728_tavg_mon_mean_climc_1901-1930.asc • USW00094728_tavg_mon_mean_climc_1951-1980.asc • USW00094728_tavg_mon_mean_climc_1981-2010.asc The anomalies from the climatological cycle (1981-2010) • USW00014735_tavg_mon_mean_ano.asc USW00094728_tavg_mon_mean_ano.asc Updated ONLINE Course Material
R: monthly mean temperature data (in degree C) • figures/ • USW00014735_tavg_mon_mean_climc_1951-1980.pdf • USW00014735_tavg_mon_mean_climc_1981-2010.pdf • USW00094728_tavg_mon_mean_climc_1901-1930.pdf • USW00094728_tavg_mon_mean_climc_1951-1980.pdf • USW00094728_tavg_mon_mean_climc_1981-2010.pdf Updated ONLINE Course Material 1951-1980 1981-2010 1901-1930 1951-1980 1981-2010