Download
1 / 19
190 likes | 198 Views
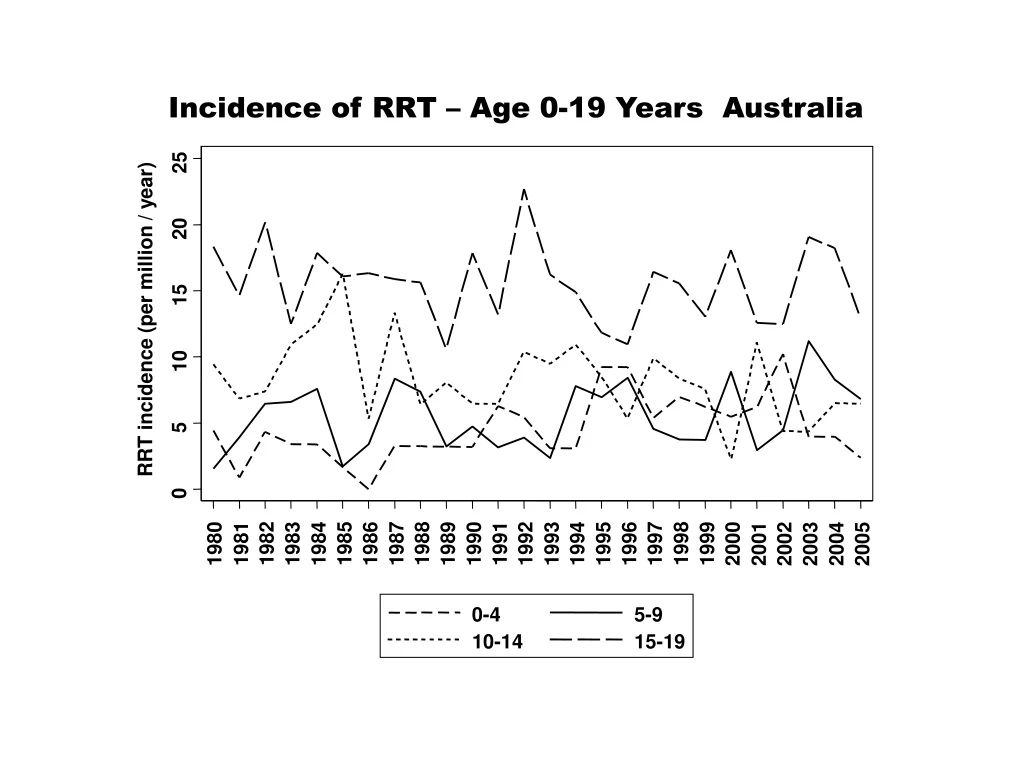
25. 20. 15. RRT incidence (per million / year). 10. 5. 0. 1981. 1982. 1983. 1984. 1985. 1986. 1987. 1988. 1989. 1990. 1991. 1992. 1993. 1994. 1995. 1996. 1997. 1998. 1999. 1980. 2000. 2001. 2002. 2003. 2004. 2005. Incidence of RRT – Age 0-19 Years Australia. 0-4.

E N D
25 20 15 RRT incidence (per million / year) 10 5 0 1981 1982 1983 1984 1985 1986 1987 1988 1989 1990 1991 1992 1993 1994 1995 1996 1997 1998 1999 1980 2000 2001 2002 2003 2004 2005 Incidence of RRT – Age 0-19 Years Australia 0-4 5-9 10-14 15-19
Prevalence of RRT – Age 0-19 Years Australia 100 80 60 RRT prevalence (per million) 40 20 0 1981 1985 1991 1995 1988 1998 1982 1983 1984 1986 1987 1989 1990 1992 1993 1994 1996 1997 1999 1980 2000 2001 2005 2002 2003 2004 0-4 5-9 10-14 15-19
Age (Years) at Transplant 1996 - 2005 100 31 33 38 39 80 45 15-19 60 28 10-14 27 20 Percentage 5-9 25 20 <5 40 16 22 24 21 26 20 24 20 17 15 9 0 1996-97 1998-99 2000-01 2002-03 2004-05
100 8 8 10 11 16 80 41 49 50 53 45 60 Other Live Donor Parent Percentage Deceased donor 40 47 43 42 39 20 37 0 1996-97 1998-99 2000-01 2002-03 2004-05 Donor Source 1996 - 2005
100 8 9 9 11 14 80 30 39 55 51 47 5-6 60 3-4 Percentage 1-2 0 40 56 46 34 35 20 35 7 2 4 5 5 0 1996-97 1998-99 2000-01 2002-03 2004-05 Number of HLA Mismatches 1996 - 2005
100 7 10 10 14 14 27 80 35 44 35 39 >3 years 60 1-3 years Percentage 0-1 year 36 Pre-emptive 40 23 37 25 27 20 30 28 22 20 19 0 1996-97 1998-99 2000-01 2002-03 2004-05 Time to First Kidney Transplant 1996 - 2005
Patient Survival 1.00 1.00 0.90 0.90 Probability of Survival 0.80 0.80 1996-1997 (95) 1998-1999 (75) 2000-2001 (81) 2002-2003 (102) 0.70 0.70 0 1 2 3 4 5 Years
Graft Survival 1.00 1.00 0.90 0.90 Probability of Survival 0.80 0.80 1996-1997 (95) 1998-1999 (75) 2000-2001 (81) 2002-2003 (102) 2004-2005 (107) 0.70 0.70 0 1 2 3 4 5 Years
Calcineurin Inhibitors at Induction Transplant Cohorts 1996 - 2005 2 0 0 100 6 21 26 31 80 44 45 51 60 percent 95 96 93 92 77 40 71 65 53 56 44 20 5 5 3 3 2 4 4 4 2 0 0 1996 1997 1998 1999 2000 2001 2002 2003 2004 2005 No CNI Cyclosporine Tacrolimus
Calcineurin Inhibitors at One Year Transplant Cohorts 1996 - 2004 2 100 6 22 29 34 80 60 65 70 75 60 percent 94 92 69 40 71 13 66 28 20 30 21 27 4 8 8 2 4 0 0 0 0 1996 1997 1998 1999 2000 2001 2002 2003 2004 No CNI Cyclosporine Tacrolimus
Calcineurin Inhibitors at Three Years Transplant Cohorts 1996 - 2002 100 7 25 80 43 47 52 72 73 60 percent 90 40 73 44 55 48 17 20 22 3 2 9 2 10 4 0 0 1996 1997 1998 1999 2000 2001 2002 No CNI Cyclosporine Tacrolimus
CNI-Free Fraction Transplant Cohorts 1996 - 2005 30 20 Percentage CNI-free 10 0 1996 1997 1998 1999 2000 2001 2002 2003 2004 2005 Transplant Cohort Induction 6 months 1 year 3 years 5 years
Steroid-Free Fraction Transplant Cohorts 1996 - 2005 30 20 Percentage prednisolone-free 10 0 1996 1997 1998 1999 2000 2001 2002 2003 2004 2005 Transplant Cohort Induction 6 months 1 year 3 years 5 years
Mean Cyclosporin Dose Transplant Cohorts 1996 - 2005 12.0 10.0 8.0 Mean CyA dose (mg/kg/d) 6.0 4.0 1996 1997 1998 1999 2000 2001 2002 2003 2004 2005 Transplant Cohort Induction 6 months 1 year 3 years 5 years
Mean Prednisolone Dose Transplant Cohorts 1996 - 2005 1.0 0.8 0.6 Mean Prednisolone dose (mg/kg/d) 0.4 0.2 0.0 1996 1997 1998 1999 2000 2001 2002 2003 2004 2005 Transplant Cohort Induction 6 months 1 year 3 years 5 years
60 42 40 33 % with rejection at 6 months 28 28 20 20 19 17 13 0 1997 1998 1999 2000 2001 2002 2003 2004 2005 Transplant Cohort Rejection Transplant Cohorts 1997 - 2004
25 23 22 22 20 20 20 20 20 15 15 15 % with Delayed Graft Function 13 10 8 7 6 5 4 4 3 0 0 0 0 0 1996 1997 1998 1999 2000 2001 2002 2003 2004 2005 Transplant Cohort Deceased donor Live donor Delayed Graft Function Transplant Cohorts 1996 - 2005
90.0 80.0 74.6 72.9 72.0 71.5 71.1 GFR at One Year 70.2 70.0 63.0 62.8 60.0 54.1 50.0 1996 1997 1998 1999 2000 2001 2002 2003 2004 2005 Transplant Cohort Mean GFR at One Year Transplant Cohorts 1996 - 2004
80.0 70.0 67.3 65.6 65.3 64.0 GFR at Three Years 59.9 60.0 56.8 53.3 50.0 40.0 1996 1997 1998 1999 2000 2001 2002 2003 Transplant Cohort Mean GFR at Three Years Transplant Cohorts 1996 - 2002