Download
1 / 14
140 likes | 143 Views
This presentation highlights the requirements for implementing comprehensive emission tracking strategies in clean air corridors to maintain visibility. It also discusses the identification of a prime candidate corridor and provides current estimates of emissions. The presentation outlines the process for tracking emissions within and outside the Clean Air Corridor, as well as the significance of emissions changes. Additionally, it explores the possibility of establishing additional Clean Air Corridors and outlines future actions and developments.

E N D
Clean Air CorridorSection 309 Requirements Presentation to WRAP Board July 24, 2002
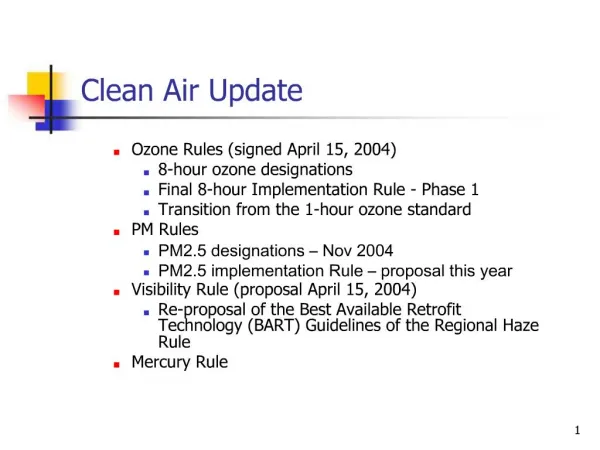
Clean Air Corridor Requirement: • SIP / TIP must describe and provide for implementation of comprehensive emission tracking strategies for clean air corridors to ensure visibility does not degrade on the least impaired days at any of the 16 Class I areas (on the Colorado Plateau).
Identification of CAC • After reviewing Grand Canyon Visibility Transport Commission work and one additional meteorological analyses, a corridor, that does not include Salt Lake City is the prime candidate for adoption under the Section 309 requirements.
Current Estimates • SO2 • Increasing 4,000 tons out of 74,000 tons (+5%) • NOX • Decreasing 38,000 tons out of 257,000 tons (-15%) • VOC • Decreasing 55,000 tons out of 210,000 tons (-26%)
Emissions Tracking Withinthe Clean Air Corridor • Report Every 5 years (with SIP update) • Use “existing” SIP processes • Backstop Market • 3-year SIP processes for other programs • Track emissions inside and “outside” Clean Air Corridor • Report on Counties / Tribal Land within the CAC coordinated through WRAP
Emissions Tracking “Outside” the Clean Air Corridor • Use existing SIP / TIP requirements • Backstop SO2 Market plus any additional stationary source requirements • 3-year State / Tribal) Land emissions inventories • Focused reporting on counties surrounding CAC • Utilize existing inventory processes
“Significance” • If emissions within the CAC increase by 25% • Based on GCVTC findings • SO2, NOX, PM, VOC • May apply spatial / chemical weighting factors for relative effects on visibility • Review emissions changes in counties surrounding the CAC • The selection of the CAC boundary may “hide” large emissions changes.
Additional CACs • At this time there is no technical information to support other CACs for the Colorado Plateau • Given the regional emissions reduction aspects of Section 309, it is expected the best visibility days will be maintained throughout the region.
Further Work • Develop action requirement for SIPs and TIPs if CAC emissions tracking approaches the “significant” level • Process to assess visibility impacts and project future emissions (through 2018) • Requirement to address concern in next 5-year SIP / TIP revision (no action or new strategies) • GCVTC projections have CAC emissions growing about 16%
Further Work • Option: Track the CAC counties nearer the Colorado Plateau separately: • Assure that growth in emissions in the “nearby” counties does not “overwhelm” the assumptions behind the historical distribution of emissions growing 25 percent. • “Nearby” emissions have a greater visibility impact