Download
1 / 13
130 likes | 137 Views
This proposed method aims to automate the determination of interhelical angles for protein alpha helices using coordinate data. The results show good agreement with observed values.

E N D
Automated determination of interhelical angles for proteinalpha helices from coordinate data Robert Fraser, James Stewart, Janice Glasgow Queen's University School of Computing, Kingston, ON
Protein Structure • Contact Maps • Helix Packing Models • Proposed Method • Results
The HUGE picture • Sequence Structure • Structure Function • I’m working on a tiny bit of the first step
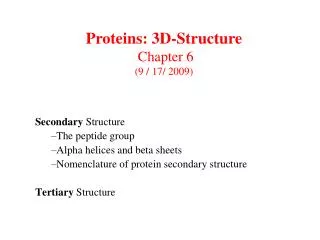
Protein Structure • Different levels of structure • We’re interested in alpha helices Used with permission from Petsko, G.A. and D. Ringe, Protein Structure and Function, 2004
Contact Maps • Distance map represents full 3D structure • Contact map is a binary version • 10Ǻ threshold used here
Knobs and Holes • Steric surface of the molecule
Angle method • if (da× db) ·(b0 – a0) > 0 • then the top vector is rotated clockwise • else the top vector is rotated counter-clockwise • Clockwise negative sign
Results • 4.1° +/- 3.2° of observed data • 3.6° +/- 1.9° after removing an outlier
Acknowledgements • Kelly Fraser • Janice Glasgow • James Stewart • Henk Meijer • Mehdi Hedjazi • Alan Ableson • Eduardo Zuviria • Tony Kuo
Thank you • Questions?