Download
1 / 40
400 likes | 907 Views
Null Hypothesis Signficance Testing. Consider the general approach and associated problems. Some thoughts. “Statistical significance testing retards the growth of scientific knowledge; it never makes a positive contribution” (Schmidt & Hunter, 1997, p. 37).

E N D
Null Hypothesis Signficance Testing Consider the general approach and associated problems
Some thoughts • “Statistical significance testing retards the growth of scientific knowledge; it never makes a positive contribution” (Schmidt & Hunter, 1997, p. 37). • “The almost universal reliance on merely refuting the null hypothesis is a terrible mistake, is basically unsound, poor scientific strategy, and one of the worst things that ever happened in the history of psychology” (Meehl, 1978, p. 817). • “A potent but sterile intellectual rake who leaves in his merry path a long train of ravished maidens but no viable scientific offspring” (Meehl again) • Cohen (1994) suggested that Statistical Hypothesis Inference Testing produces a more appropriate acronym. • What is NHST? What isn’t it? And what is the problem?
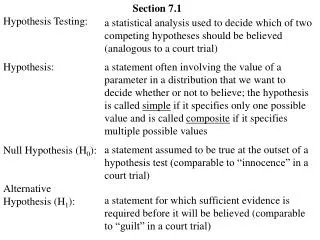
What is hypothesis testing about? • Using an inferential procedure to examine the credibility of a hypothesis about a population • We start with a research question, develop specific hypotheses to test, collect the data and then use statistical analysis to test them • But what exactly is this analysis we use?
How is NHST made possible? • The sampling distribution tells us the degree of variability to expect with regard to some statistic. • We can then see whether our sample stat varies greatly from the random error we would expect from sampling from a population with a particular value (point estimate) for that statistic. • Example: are the mean of SAT test scores of students from this school all that different from the national average?1
Two approaches, many problems • Psychology and other social and behavioral sciences have actually taken two approaches developed independently and put them together in such a way that lead to many problems in interpreting results • One approach is data driven (Fisher) • The other is design driven (Neyman & Pearson)
Fisher vs. Neyman vs. • For heavyweight stats champion thingy
Fisher’s approach • 1) State the research question • 2) State the null hypothesis • 3) Construct a sampling distribution based on the null hypothesis and calculate the test statistic • 4) Note the associated probability of obtaining that test statistic (i.e. p(D|H0) • 5) Use the p-value to ascertain whether you will reject the null or come to no conclusion • 1. Do guys and gals differ in their assessment of John McCain’s ‘electability’? • 2. The difference in mean electability ratings is zero • μmale - μfemale = 0 • 3. Depends on sample size but the t-distribution would be appropriate • 4. You found a difference, what is the probability of coming up with that size of a difference if you were expecting no difference? • Based on that observedp-value, do you reject or fail to reject?
Note that the p-value in this sense is used as a measure of disbelief in the null hypothesis1 Despite the fact it is not a probability as to the likelihood of the null hypothesis It is p(D|Ho) not p(Ho|D) However, it is confounded by sample size and so cannot be considered sufficient evidence against the null by itself All else being equal, increasing N decreases the p-value Central Limit Theorem Unfortunately it often is interpreted without regard to sample size, unless of course the sample size is small “It would have been significant I swear!” P - value
Why “fail to reject”? • Why not just accept the null hypothesis? • Null hypothesis value is precise (in this case zero), but also arbitrary • Lots of data might be apparently consistent with H0 • For example, if you obtained a difference of 2 and it was not large enough to reject no difference, how do you know that the true population difference isn’t 1 or any other infinite possibilities that are near zero?1 • However you do see researchers accepting the null hypothesis and then drawing conclusions from this • Not the way to do things according to Fisher or logic
Neyman and Pearson’s approach • 1) State the research question • 2) State the null hypothesis, and alternative hypothesis1 • 3) Construct a sampling distribution based on the null hypothesis and locate the region of rejection (i.e. find the critical value on your table) • 4) Calculate the test statistic and see where it falls along the distribution • 5) Reach a decision to reject the null or retain the null based on whether the test statistic falls in the region of rejection2 • 1. Do guys and gals differ in their assessment of John McCain’s ‘electability’? • 2. Ho = μmale = μfemale • H1 = not Ho3 • 3. Design the study • A. Now we have to design our study (i.e. determine sample size) based on a set α level and power desired e.g. α = .05, power .80 (i.e. β = .20) that reflect the error rates we want to maintain • Note that this is done before data is collected! • B. What is the associated critical value/region of rejection? • 4. You found a difference and in this case have an observed t-statistic • 5. Is your observed t more extreme than the t critical value (i.e. does it fall into the region of rejection)? • YES? Reject the null. • NO? Act as if the null were true.
Key differences • Fisher • No alternative hype, no talk of alpha/beta, decision based on the observed p • Level of significance p-value • How determined • Early Fisher: set some acceptable standard, say .05 • Later: State exact level as a communication to researchers1 • Epistemic interpretation about the likelihood of the null hypothesis (how much do we believe in the false null), p is a property of the data • Non-significant result: Do nothing, can’t prove the null can only falsify (to some extent) • N-P • Alternative hypothesis, alpha/beta/power concerns that determine the design of the study, decision based on observed t-statistic either falls into the region of rejection or doesn’t (if not accept the null)2 • ‘Level of significance’ α • Must be set before the experiment to interpret it as a long run frequency of error (type I) • So now that we have this new sort of thing to worry about (), how do we make it more confusing? • Set the standard level at… .05. • Behavioristic interpretation (reject or don’t) that refers to repeated experimentation, p is a property of the test /design • The actual observed p-value doesn’t matter, our statistic either falls in our region of rejection or doesn’t • Non-significant result: Accept null
Probability: Fisher • Probability obtained tell us: • If the null hypothesis were true, this is the probability of obtaining a sample statistic of the kind observed • What we want it to mean • P(H0|D) • We want the p value to be a probability about a hypothesis • Some probability of H0 conditional on the data
Psychology today- the hybrid • “A mishmash of Fisher and Neyman-Pearson, with invalid Bayesian interpretation” • Fisher and N-P interpretations of p-value, incorrect inferences about the probabilities of hypotheses or error rates, dogmatic approach to scientific investigation • Luckily this is changing, though slowly
The ‘permanent illusion’ • The logic of NHST can be difficult to grasp • Deductive side (conditional reasoning) • If the null hypothesis is true, this data would not occur • The data has occurred • The null hypothesis is false • This is true by denying the consequent (modus tollens) • Unfortunately this is not how hypothesis testing takes place • Gives us the illusion of probabilistic “proof”
Hypothesis Testing In Its True Form • If the null hypothesis is true, this data would be unlikely • The data has occurred • The null hypothesis is false • The problem is that we make the first statement probabilistic, and that changes everything
Hypothesis Testing • If a person is an American, then he is not a member of Congress • FALSE • This person is a member of Congress • Therefore, he is not an American • This is a valid argument but untrue as the first premise is false • If a person is an American, then he is probably not a member of Congress • TRUE • This person is a member of Congress • Therefore, he is not an American • This is the form of hypothesis testing we undertake, and though the first statement is now true, the argument is logically incorrect
The permanent illusion • This illusion of probabilistic proof by contradiction reflects our desire to have a probabilistic statement regarding a hypothesis arising from the data • Unfortunately we only have the probability of the data given the truth of a null hypothesis • P(D|H0) ≠ P(H0|D)
The Bayesian Approach • Recall that we’ve described research in psychology as evidence gathering and presenting a case for others to take into consideration • Part of the evidence gathering should include reliance on the results of previous research • We can choose to do this explicitly in our analyses
The Bayesian Approach • Bayesian inference actually includes prior information to inform the present situation1 • Although the priors may be largely “subjective”, the procedure can provide a p-value for a hypothesis • And in fact it has been shown that we use this regularly in our daily lives
The gist with the Bayesian approach is that you end up with a probability regarding a hypothesis and more centered on prior beliefs than frequency of outcomes The key is that you have to think hard about what a viable alternative hypothesis would be, as well as the likelihood of either hypothesis While this might be too subjective of an approach for some (it was for Fisher), others feel it doesn’t make sense to go about things otherwise.1 The Bayesian Approach
Another misinterpretation that comes from the confusion regarding a probability of a hypothesis, some think the probability of replication can be estimated with a NHST p-value P(D|H0) does not imply anything about p(Replication) either Replication
Belief in the Law of Small Numbers (Kahneman & Tversky) Some believe that significant results arising from presumably representative (though relatively small) samples are automatically strong findings that will most likely replicate1 The fact is that the significant result may be very unlikely to replicate Also, just because we reject the null does not imply a theory is correct The statistical test rarely reflects the actual research idea2 P(D|H0)
The nil hypothesis • Another criticism of current NHST methodology is the rejection of a nil hypothesis • Nil hypothesis: no effect • Essentially this is setting up a straw man, we go after a weak target, refute it, and pretend we have something to show and pat ourselves on the back by doing so • In a sample there is always a difference to some extent, there is always some relation between variables1 • Can you tell which of the following correlations came from two random (i.e. independent) variables (N=25)?2 • .107 • -.325 • .261 • .013 • -.130 • .114 • -.107 • -.118 • -.069 • .043
Summary of Problems with NHST • Misinterpretations of p-values • Probability that the result is a result of sampling error • i.e. p = .05 means only a 5% chance it’s due to chance (sampling error) • There is a 100% chance the result is due to sampling error • Probability of the null hypothesis • Is attainable through Bayesian approach but not NHST • Probability that if the null hypothesis is rejected, we’d be wrong • That’s α • That 1- p = the probability of the alternative hypothesis • Again, attainable through Bayesian approach but not NHST • That 1 – p = probability of replication
Summary of Problems with NHST • Mistaken conclusions • That the p suggest something about the magnitude of effect by itself • Also, that failure to reject null means the population effect size is zero- Absence of evidence is not evidence of absence • Rejection of null means the alternative hypothesis is true • Failure to reject implies equivalence • More on that later • Rejecting the null means the design was sound • If no rejection, the study is a failure • Rejection of null identifies causality • Failure to replicate refers to conclusions about the Ho • The effect size may be the same but due to sample size, one rejects, one doesn’t
Is NHST that bad? • What’s right with NHST? • As Krantz and many others (even later Meehl) have pointed out, statisticians have no real issues with NHST in and of itself, so why do the psychologists? • The problem lies in interpretation, not necessarily of method • The problem with p-values • Don’t tell us the probability of a hypothesis • Not an estimate of practical importance • The problem with α • Can change when assumptions don’t hold or data is incorrectly collected • Never know if we are actually making the error • Controlling β is probably a more pressing issue in most situations in the social sciences yet there is far less concern with it
Is NHST that bad? • It does address sampling error • Some research questions require a dichotomous answer • Is this better than that? • So NHST does have utility and is itself not to blame for its misuse and misinterpretation
Psychologist’s view of statistics • Quantitative psychologists typically have a much different take on statistical analysis than the more applied researcher • Focus is more on strong theoretical reasoning, sound design and measurement, and looking for large or obvious effects • The average joe psychologist however tends to focus more on statistical significance to back up their idea
The abuse of hypothesis testing • As Cohen noted, NHST has largely been abused in psychological research • Over-reliance on arbitrary ‘significance’ levels rather than effect sizes • General misinterpretation of results • For example, smaller ps representing ‘more significant’1 results • Inadequate reporting of information
What’s the alternative? • Although much knowledge has been gained using NHST over the years the problems with interpretation cannot be ignored • So what should we do? • “A magic alternative to NHST, some other objective mechanical ritual to replace it. It doesn’t exist” (Cohen, 1997, p. 31) • Bayesian inference (which does give P(H|D), but has its own problems) • More focus on confidence intervals • Effect sizes • Better NHST • Graphs and more descriptives
Solutions: Bayesian • Benefits: probabilities and intervals that make sense • Gives P(H|D) • Problems: we’re substituting one framework for another • Too subjective? • Standards for priors? • Would conclusions drawn be that different?
Solutions: Confidence intervals • Provide a way to test hypotheses while also giving more information to use in the assessment of results • Point estimate still provided • NHST is still conducted • Confidence in results are reflected in width of interval • Wider = more ignorant • More overlap suggests less difference in estimates • May lead to more thinking about the size of the differences rather than statistical significance
Solutions: Effect Sizes • Effect sizes • Should be standard reporting at this point (getting there), it should also be standard that they are the focus of interpretation (still a long way off) • Problem: Effect sizes are subject to sampling variability just like anything else • Provide CIs for effect sizes
Solutions: Other NHST approaches • Jones & Tukey 2000 (Kaiser, 19601) • Dueling alternatives • Problem: still dichotomous decision based on lone p-value • Equivalence testing for group comparisons • Shifts focus to meaningful effect size • Shifts focus to uncertainty of results • Can claim difference, equivalence, or not enough info • More later
Solutions: Visual and descriptive interpretation • Never underestimate the power of a good graph or the trends able to be spotted in descriptive information that might be clouded among multiple hypothesis tests • Basic question: What seems to be going on?
Don’t forget to use your noggin when conducting analyses- don’t let SPSS or textbooks tell you what it means.1 There are other ways to analyze data without using NHST. But don’t fall in to the same trap of rigid thinking with those either. Focus on effect sizes and interval estimation, report as much information as possible, let others know exactly why you came to your conclusions Collect good data (not as easy as it sounds) and have good theories and clear ideas driving the motivation for your research. Let the data tell its story Replicate whenever possible, validate your own data Solutions: General
Hypothesis testing should include… • Checking the adequacy of a model • Check assumptions and do something if problems arise • Use valid and reliable measures of the construct under investigation • Use the test of a nil hypothesis as a preliminary step at most • Test approximate null hypotheses • Make appropriate decisions based on the situation • It’s not just about type I error at .05
Resources • Gigerenzer, G. (1993). The Superego, The Ego and the Id in Statistical Reasoning. In Keren & Lewis (Eds.) Data Analysis in the Behavioral Sciences. • Cohen, J. (1994). The earth is round, p < .05. American Psychologist, 49, 997-1003. • Hubbard R. & Bayarri, M.J. (2003). Confusion Over Measures of Evidence (p's) Versus Errors (α's) in Classical Statistical Testing. The American Statistician. Volume: 57 Number: 3 Page: 171 – 178 • Oakes, M. 1986. Statistical Inference: A Commentary for the Social and Behavioral Sciences. Chichester, John Wiley & Sons. • Abelson, Robert. Statistics as Principled Argument. Mahwah, NJ:Erlbaum, 1995. • Some quotes: http://www.indiana.edu/~stigtsts/quotsagn.html