Download
1 / 30
300 likes | 448 Views
EXPO 2000 traffic management with VISUM-Online. What is Visum-Online ?. basic traffic estimation / forecasting algorithms for traffic management centres extension of proven VISUM platform jointly developed by PTV and Siemens fully integrated with PTV Vision and Siemens Concert Installations

E N D
What is Visum-Online ? • basic traffic estimation / forecasting algorithms for traffic management centres • extension of proven VISUM platform • jointly developed by PTV and Siemens • fully integrated with PTV Vision and Siemens Concert • Installations • Hannover (move GmbH) • München (part of federally funded research project MoTIV) • Antwerp, Belgium (under development) • Berlin, Germany (under development) • Shenzhen, China (in preparation)
Why VISUM-online? • Numerous ITS facilities are deployed to improve traffic conditions, e.g. in Hannover: • 32 VMS for dynamic route guidance on motor way • 80 km of motorway with VMS speed control • twice daily tidal flow one-way traffic on major highway • 3 parking guidance systems (City, EXPO, P&R) • direct access to signal control programs • Links to • Roadworks Information System • Command & Control System of police and fire brigade • Operations control system for public transport • Call Centre for mobility services
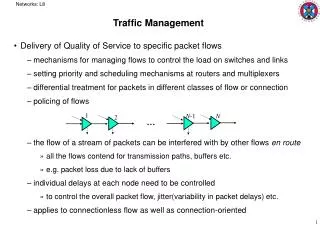
Why VISUM-online? • Support decisions about traffic management measures through • display of current level of service (LOS) • preview of LOS for 30 - 60 minutes • forecast of effects on LOS of proposed traffic management measures
Input Networks Input Demand Output Model Architecture of Visum-Online Transportation Modelling (VISUM-online) • Verkehrslage • Verkehrslage in 15,30,45,60 min • Prognose nächster Tag • Fij-Matrizen: • Normalverkehr • Veranstalt-ungsverkehr • Datenvervoll-ständigung • Kurzfrist Prog. • Tagesprognose A: Navigation B: Planung C: Prognose graphical UI graphical UI ODBC ODBC ODBC ODBC relational database (Oracle) SubsystemInterface SubsystemInterface SubsystemInterface SubsystemInterface External Data (Subsystems) Incidents Traffic Control Traffic Counts Network • Dynamische Daten • Baustellen • Richtungswechsel LSA Parkleitsystem Park+Ride Info Schleifen Video Infrarot. RDS-TMC Polizei ELR
Volume Volume Impedance Impedance Demand Demand PTV AG Hannover: Available Data Sources • Traffic volume at selected detector loops (motorway, signal controlled junctions) • Speed at delected detector loops (motorway) • State of variable message signs and route guidance • Messages from RDS/TMC radio warning system • Current roadworks and incidents • Car park status (percentage filled) • Major cultural events (with impact on demand) • During EXPO 2000: advance ticketing information • Weather
Hannover: Output • Sensor fusion: GIS system allows simultaneous viewing of all traffic-related information • Level of service (LOS): interpolation of most recent measurements produces volume + speed on all network links • Short-term forecast: extrapolation of current LOS for next 30 minutes (traffic flow simulation) • What-if forecast: like short-term forecast, but with the assumed effects of a proposed traffic management measure • Medium-term forecast: LOS for the next day based on historic trend lines and current information about events, road closures etc. • Visualisation for traffic management operator and distribution of traffic information via Internet, TV, Fax, email, print media
Data Completion VISUM-online
Algorithm for Data Completion (1) • Input • OD matrix as initial solution • volume from isolated detectors • Algorithm • Path Flow Estimator (PFE) by Mike Bell, University of Newcastle on Tyne, UK • Principle • Iterated equilibrium assignment with simultaneous adjustment of impedances • Result • Estimated current OD matrix • Routes
Algorithm for Data Completion (2) • Input • Routes with volumes from PFE • measured volume and speed from detectors • Algorithm • Propagation algorithm by PTV • Principle • propagate q and v onto links in the neighborhood of detectors, degree of confidence decreases with distance from detector • Result • volume and speed on all network links • reproduces inhomogenous distribution of vehicles along routes
Algorithm for Short-Term Forecast • Input • Link volumes from propagation algorithm • OD matrices and routes from PFE • „Effects of measures“, e.g. roadworks, signal programs • Algorithm • mesoscopic traffic flow simulation (Dynemo) • Principle • movement of individual vehicles in accordance with macroscopic indicators of traffic situation (density, avg. speed) • Result • 30 - 60 minute forecast of volume and speed on network links • travel time forecasts on fixed routes
Strategy A 30 min 30 min Strategy B Short-term Forecast under scenario assumptions
Algorithm for Day Forecast • Input • static network • „Effects of measures“, e.g. roadworks, signal programs • hourly OD matrices (base traffic + visitor traffic) • Algorithm • dynamic assignment • Principle • assignment in 15 min slices, taking into account unfinished trips from previous slices, vehicles „jump“ in 15 minute steps • Result • 1 day forecast of volume and speed on network links
Architecture of Hannover System Multivision Display Wall Editor Traffic Management Police LAN Sensor Fusion Analysis Forecasts Core Database User Interfaces to Subsystems LAN Variable Message Signs Parking Guidance Data Flow Actuators Traffic Volume, Weather, Incidents, Events
Visum-Online Display of detector readings
Hierarchy of Networks Networks differ in level of detail: Forecast network: ~3800 links ~220 zones • Case 1: Link represents future network, therefore only present in planning network • Case 2: Link is part of subordinate network, therefore only present in navigation network Prognosenetz Planning network: ~12000 links ~650 zones • Case 3: Main road, therefore present in all 3 layers, but with varying number of intermediate nodes Planungsnetz Navigationsnetz
Traffic flow effects of incidents • Incidents and roadworks decrease the capacity of the infrastructure and potentially lead to congestion. • This effect is uniformly modelled by decreasing qmax (capacity) and v0 (free flow speed) • Subsystems do not attach resulting qmax and v0 to roadworks and incident messages, therefore traffic engineer in managament centre appends this information • Generating complete alternate network versions for temporary effects is too much overhead and complicates modelling simultaneous measures • Solution: Effects are stored as „infrastructure effect lists“ (German: Netzwirkungslisten, NWL). Each NWL contains a list of tuples(Network element, attribute, new value, validity period)
commit set name and default validity period
add to NWL root select link
appears in NWL tree view commit set effect set validity period
Hannover system: further functionality • demand editor (visitor traffic) • editor for scenario definition (incl. simulation) • difference view for comparing two simulation results • aggregation of detail data to historic trendlines • display of operating status, control of subsystem converters • user administration, user rights • ...
Hannover system: initial experience • Phased deployment • CeBIT 1999: basic visualisation of traffic counts • Autumn 1999: data completion and short-term forecast • CeBIT 2000: day forecast • Quality of results • Data completion and day forecast good, but detector coverage still sparse in many areas • Short-term forecast currently only on motorways and freeways, will be extended as more detectors come on-stream
upstream of accident accident downstream of accident
Quality of Results • Measured and predicted (in absence of detector) traffic volumes are almost identical (Flow_real vs. Vol_PFE) • Predicted speed has correct profile, but consistently too low (-> v0 needs to be recalibrated)
VISUM-online: a traffic manager‘s dream for more information: klaus.noekel@ptv.de