Download
1 / 14
150 likes | 204 Views
Protein Secondary Structure Prediction Based on Position-specific Scoring Matrices. Yan Liu Sep 29, 2003. Protein Secondary Structure. Dictionary of Secondary Structure Prediction (DSSP) based on hydrogen bonding patterns and geometrical constraints 7 DSSP labels for PSS:

E N D
Protein Secondary Structure Prediction Based on Position-specific Scoring Matrices Yan Liu Sep 29, 2003
Protein Secondary Structure • Dictionary of Secondary Structure Prediction (DSSP) • based on hydrogen bonding patterns and geometrical constraints • 7 DSSP labels for PSS: • Helix types: H(alpha-helix)G(3/10 helix) • Sheet types: B(extended strand, participates in beta ladder) E (isolated beta-bridge strand) • Coil types: T _ S(Coil)
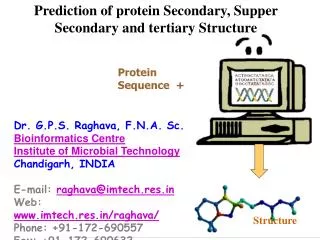
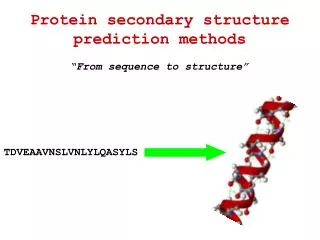
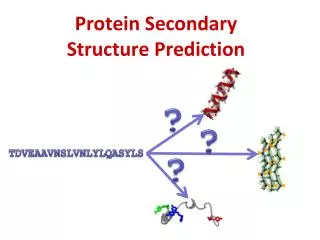
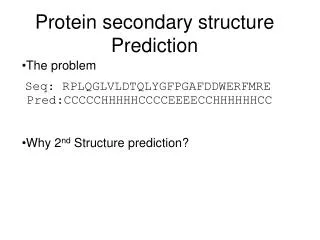
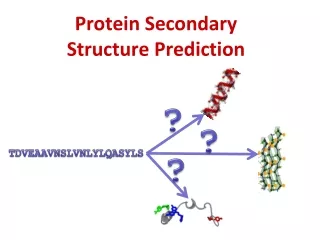
Protein Secondary Structure Prediction • Given a protein sequence: • APAFSVSPASGA • Predict its secondary structure sequence: • CCEEEEECCCC • Application • Provide constraints for tertiary structure predictions or as part of fold recognition
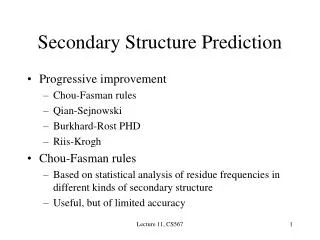
Related Work • Standard SS prediction methods: PHD (Rost & Sander 1993) • Multiple sequence profiles • Based on the observations that conserved regions are functional important, and (or) buried in the protein core • Benner & Gerloff demonstrated that the degree of solvent accessibility can be predicted with reasonable accuracy • Two-layered feed-forward Neural networks
PSIPRED: • Generation of a sequence profile • Position-specific score matrices • Prediction of initial secondary structure • Standard feed-forward back-propagation networks • Filtering the predicted structures
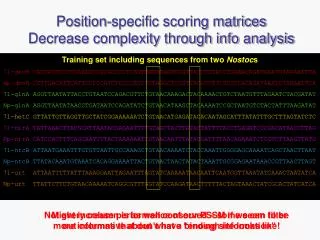
Position-specific scoring matrices (PSSM) -1 • PSSM (Altschul et al., 1997), or profiles • Given a protein sequence with length N, together with its multiple sequence alignment • Construct a Nx20 matrix • Score definition • Different methods for estimating Qi • Alpha = Nc-1, beta = 10 • Fi: weighted observed frequencies • Other estimation:
Position-specific scoring matrices (PSSM) -2 • Advantage • A more sensitive scoring system • Improved estimation of the probabilities of which amino acids occur at pattern position • Relatively precise definition of the boundaries of important motifs • Disadvantage • Too sensitive to biases in the sequence data banks • Prone to erroneously incorporating repetitive sequences into the profiles
PSSM in PSIPRED • Input to neural networks: • The PSSM from PSI-BLAST after three iterations • Set to window size to 15 • Scaled to the 0-1 range by standard logistic function
Neural network architecture-1 • Two stage neural networks • 1st stage: Sequence to structure mapping • 315 inputs: 21 * 15 • 75 hidden units: 3 * 15 • 2nd stage: Structure to structure mapping • 60 inputs: 4 * 15 • 60 hidden variable: 4 * 15 (extra input to indicate the window spans a chain terminus)
Neural network architecture-2 • Training parameters • Momentum term: 0.9 • Learning rate: 0.005 • Prevent overfitting: leave 10% of the training set for validation
Experimental results • Training and testing data • Collected to remove structural similarity • Apply CATH to detect homologous protein sequences • A total of 187 protein sequences: 62, 62, 63 • Three-way cross-validation
Experimental results • Per-chain results • Distribution of Q3 and SOV (left) • Avg Q3: 76.0% • Avg SOV: 73.5% • Per-residue results • Q3: 76.5%
Experimental results • Rank top 1 in CASP –3 • Avg Q3: 73.4% (69.0% by top 2, 66.7% by PHD) • Avg SOV: 71.9% (65.7% by top 2, 63.8% by PHD) • Also rank top 1 in CASP –4 (Dec, 2000)
Conclusion • PSIPRED is by far the best method for secondary structure prediction • The difference between PHD and PSIPRED: • Position-specific scoring matrices • Training data