Download
1 / 26
260 likes | 393 Views
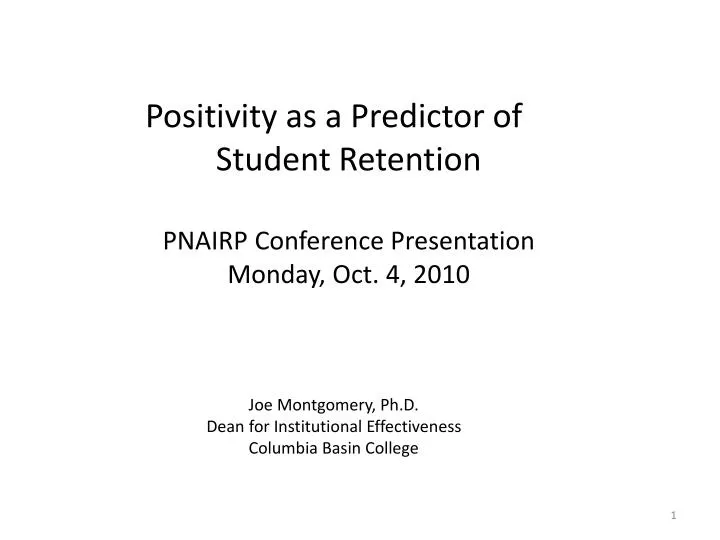
Positivity as a Predictor of Student Retention PNAIRP Conference Presentation Monday, Oct. 4, 2010. Joe Montgomery, Ph.D. Dean for Institutional Effectiveness Columbia Basin College. Retention as a Major Concern for Colleges.

E N D
Positivity as a Predictor of Student Retention PNAIRP Conference Presentation Monday, Oct. 4, 2010 Joe Montgomery, Ph.D. Dean for Institutional Effectiveness Columbia Basin College
Retention as a Major Concern for Colleges • Considerable resources are devoted to reducing student attrition: • Counseling/Advising • First Year Introduction (FYI) • Probation programs • Tutor Center • Student Support Services • Faculty involvement • Nonetheless, fall-to-fall retention is about 50% • Four-year graduation rates at around 30% • Even lower retention rates for students enrolled in dev math • Studies of student attrition often find that work responsibilities • and financial issues contribute to some students leaving– but • not all. These factors aren’t under college control • There is definitely a need for greater understanding of student • attrition and effective interventions
Definition of Positive Psychology • “Scientific study of optimal human functioning” • P.P. helps people develop qualities that lead to greater fulfillment • for themselves and others • Main dimensions: • - Positive emotions and subjective states, constructive thoughts, • optimism, hope • - Positive individual traits (e.g., courage, persistence, honesty, • wisdom) • - Positive institutions (e.g., healthy families, work environments, • positive communities) • Shifting attention from alleviating human suffering (medical model) • to cultivating human flourishing • Why is this of interest to us in IR?
Positivity • Defined by Fredrickson as moments of positive emotion that • quickly come and go (fits in with first dimension of PP) • Occurs when we feel connected to others, loved, playful, • joyful, creative, excited. Includes emotions of love, • joy, gratitude, serenity, interest, inspiration • Positivity is the building block for her “Broaden and Build “theory • - With more positivity we feel good • - Positive affect changes how our mind works–literally! We are • smarter, more creative, more open to new ideas etc. • - Builds our resources for the future– new skills, interests, • better relationships, greater resilience • - Blocks negativity, reduces negative symptoms of stress • (e.g., reduces blood pressure) • - “Tipping point” effect: our lives dramatically improve when • “Positivity ratio” exceeds 3/1 • - We can take charge of an increase our positivity; noticing • when it occurs is a big first step
Link Between Broaden and Build and Retention Hypothesis: Positivity is associated with many positive outcomes, including creativity, expanded awareness, greater intelligence, favorable relationships. Consequently, students high in Positivity should perceive college as being less difficult, more rewarding, have more positive perceptions of the college, and should perceive fewer barriers to their education. Students higher in Positivity should be more likely to stay in school, graduate/transfer, and report more satisfaction with their education, as compared to low Positivity students.
CBC Student Survey 7 main sections, 124 items (mostly 5-point Likert-type items) Part I. Student Education and Learning A. Educational activities (e.g., class participation, integrating ideas from multiple sources, working with other students, etc.) B. Educational experiences (items related to faculty teaching style, class discussion, higher-level thinking, etc.)– items derived from Ken Bain’s book What the best college teachers do Part II. Educational and Personal Growth– Personal Development (how much CBC has prepared them to transfer, provided a broad education, prepared them for employment) Part III. CBC as an Institution(able to enroll in desired classes, placement, advising, Resource Center, Tutor Center, cultural events) Part IV. Potential Barriers to College Success (work responsibilities, financial pressures, high school academic preparation, family support) Part V. Positivity items (taken from Fredrickson, 2009, with permission) Part VI. Overall Evaluation of Education at CBC (quality of instruction, value of education, interactions with instructors, preparation for transfer, equipment and technology, etc.) Part VII. Student Demographics (full/part time, work schedule, credits earned to date, gender, ethnic group, major, parents’ education, income, etc.)
Positivity Scale (Fredrickson, 2009) • Consists of 20 “Emotional Descriptors” • Students rate the “greatest amount” that they experienced each • feeling within the past 24 hours, from “not at all” to “extremely” • 10 positive items. Examples include: • Amused, fun-loving, silly • Awe, wonder, or amazement • Grateful, appreciative, or thankful • Hopeful, optimistic, or encouraged • 10 negative items. Examples include: • Angry, irritated, or annoyed • Contemptuous, scornful, or disdainful • Embarrassed, self-conscious, or blushing • Available online at www.positivityratio.com/single.php • Her approach to scoring: count positive items rated 2 or higher (P), • count negative items rated 1 or higher (N), compute P/N • Goal is to exceed the “tipping point” of 3.0
Comments on Scoring Positivity Scale • Fredrickson’s scoring procedure is puzzling– she takes interval-level • data (from Likert items) and converts them to simple counts (nominal • scale), thus losing lots of information • I added my own scoring procedure– after establishing strong internal • consistency reliability, computed summative score for Positive • and Negative items, ratio of Positive/Negative and compared these • values with Fredrickson’s measure • Reliability results: • Positive Items: Alpha= 0.89 • Negative Items: Alpha= 0.84 • All Items: 0.77 • Note: reliability values for each section of the Student survey exceeded 0.70
Correlations Between Positivity Measures and Barriers to Education
Part V. Emotional Well-Being Items Positive Descriptors Negative Descriptors 16
Likert and Fredrickson P-Ratios: Regression with Quadratic Term • Y= .564+ .665*Fred+ • (-.042*Fred-squared) • Fredrickson’s 3.0 tipping point • corresponds to 2.18 0n the • Likert-based P ratio
Summary/Conclusions • Fredrickson’s Broaden and Build Theory suggests that • students low in positivity may be at a cognitive and emotional • disadvantage in terms of completing their education, hence • more likely to drop out • Students with higher ratings on negative affect items and lower P • ratios perceived greater barriers to educational success • Within the Barriers scale, the P-ratio and Neg. Emotions correlated • with “difficulty completing the math requirement”, “feelings of • depression and anxiety”, “inadequate financial support from my • family”, “difficulty connecting with the faculty”, “lack of family • support, encouragement” • Implications: early identification of those low on “P” and • establishing interventions may reduce the risk of dropping out • 2010 cohort study: longitudinal tracking of students, following • initial Psychological Well-Being assessment