Download
1 / 27
270 likes | 440 Views
Modeling of Historical Evolution of Salt Water Distribution in the Phreatic Aquifer in and around the silted up Zwin Estuary Mouth (Flanders, Belgium). Luc Lebbe , Sarah Jonckheere & Alexander Vandenbohede Department of Geology and Soil Science, Ghent University, Gent, Belgium.

E N D
Modeling of Historical Evolution of Salt Water Distribution in the Phreatic Aquifer in and around the silted up Zwin Estuary Mouth (Flanders, Belgium) Luc Lebbe, Sarah Jonckheere& Alexander Vandenbohede Department of Geology and Soil Science, Ghent University, Gent, Belgium
LOCATION OF STUDIED AREA Map of Belgium Studied area is located between Zeebrugge and the Dutch-Belgian border
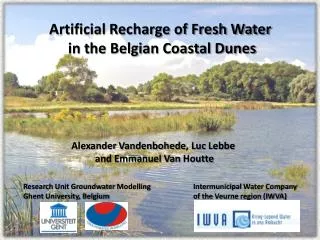
Evolution of Fresh-SaltDiSTRIBUTIOnaround Zwin estuary mouth is modeled for a period of C. five centuries The Zwin Estuary is the former waterway to Flemish medieval seaports of Sluis, Damme and Brugge (Bruges) During the considered modeling period this estuary silted up and the modeled area changes from an area around an estuary mouth over a tidal flat to a rather complex polder dune area.
MODELING OF HistoricALevolutiONOF SALT WATER dISTRIBUTIONin and around the silted up Zwin Estuary Mouth • Applied software MOCDENS3D (Oude Essink, 1998) and VisualMOCDENS3D (Vandenbohede, 2007) • Applied finite-difference grid: - 70 rows (width of all row = 50 m) - 88 columns (width of all columns = 50 m) - 12 layers (thickness of each layer = 2 m) - angle between north and row direction is 75° turning to the east
Modeled AREA (4400 m on 3500 m) AND FINITE DIFFERENCE GRID Row direction is parallel to present day low water line
Hydraulic Parameters Phreatic aquifer is formed by sandy deposits. Heterogeneity is important. Horizontal and vertical conductivities are deduced by the performance and the interpretation of three pumping tests (range Kh = 1.5 - 45 m/d, Kh/Kv = 25). Hydrogeological data base (VMM) is used to generate the transmissivity matrix and the vertical leakance matrix.
PARAMETERS OF SOLUTE TRANSPORT • Water conductive porosity is 0.38 • Longitudinal dispersivity is 0.2 m • Transversal dispersivity for hor. flow is 0.02 m • Transversal dispersivity for vert. flow is 0.01 m • Density dependent flow • Density of salt water = 1020 Kg/m³ • Density of fresh water = 1000 Kg/m³
Boundary CONDITIONS Boundary conditions on shore and banks of estuary in uppermost layer depend strongly on the surface elevation. Therefore the reconstruction of the historical evolution of the surface elevation is very important. Rech. dunes=280 mm/y Rech. polders= 28mm/y W. & E. boundary coincide with flow lines Impervious boundaries N. & S. boundary are constant head boundaries
historiCAL EVOLUTION OF LoCATION AND ELEVATION OF THE SHORE, The ESTUARY BANKS AND THE TIDAL FLATS ARE DEDUCED FROM ONE PAINTING, FOUR OLD MAPS AND THE PRESENT DAY MAP Basedonwork of Historian Johan Termote (2004) of the TouristDevelopmentAgency‘Westtoer Digital Terrain Model (DTM or DEM) is deducedfrom the abovementioneddocuments First document is painting of POURBUS (1571) of the region ‘Brugse Vrije’ Following are fouroldmaps : Wilschut (1737-1740), Lammeire (1784), Van der Maelen (1846), De Mey (1880) and the present day map Eight stress periods are consideredwith a duration of c. 60 y
PuRposes OF The SeLECTED RESULTS • To demonstrate the occurrence of inverse density distributions under the shores and the banks of estuaries • To demonstrate that the shapes of these distributions are strongly depended of the slope of the estuary bank and of the heterogeneity of the phreatic aquifer • To demonstrate how these distributions evolve when entrapped under an area with a small hydraulic gradient ( e.g. a tidal flat)
DEDUCed DTM of MODELED AREAbasedonpainting OF POURBUS (1571)
Fresh water head (WHITE contour LinEs) andsalt water percentage (colors) OF Layer 2 During SECOND HALF OF 16th CENTURY
Fresh water head (WHITE contour LinEs) andsalt water percentage (colors) IN N-S CrOSS SECTION (CoLumn 85, EAST BOUNDARY) During SECOND HALF OF 16th CENTURY
DEDUCED DTM of MODELED AREA FIRST HALF OF 17th CenTURY East ward movement of estuary with smaller draft for ships Decrease slop left estuary bank ; increase slop right estuary bank .
Fresh water head (WHITE contour LinEs) and salt water percentage (colors) IN Layer 2 AROUND MIDDLE OF 17th CENTURY
Fresh water head (WHITE contour LinEs) andsalt water percentage (colors) IN N-S CrOSS SECTION (CoLumn 85, EAST M. B.) AROUND MIDDLE OF 17th CENTURY
RECONSTRUCTED DTM of MODELED AREA IN THE SeCOND HALF OF THE 17th CenTURY East ward movement of estuary which is almost completely silted up Erosion of eastern dunes
Fresh water head (WHITE contour LinEs) and salt water percentage (colors) IN Layer 2 AT THE END OF THE 17th CENTURY
Fresh water head (WHITE contour LinEs) andsalt water percentage (colors) IN N-S CrOSS SECTION (CoLumn 85) AT THE END OF THE 17th CENTURY
DEDUCED DTM of MODELED AREA BASED ON WILSCHUT MAP (1737-1740) Eastern dunes fade away and the estuary is changed into a tidal flat Enlargement of polders by the construction of the Saint Paul’s Dyke
Fresh water head (WHITE contour LinEs) and salt water percentage (colors) IN Layer 2 During SECOND HALF OF 18th CENTURY
Fresh water head (WHITE contour LinEs) andsalt water percentage (colors) IN N-S CrOSS SECTION (CoLumn 85) IN THE SECOND HALF OF THE 18th CENTURY
DEDUCED DTM of MODELED AREA BASED ON LAMMEIRE MAP (1784) Landward movement of high water line Western dunes are eroded and shore has a rather large slope .
Fresh water head (WHITE contour LinEs) and salt water percentage (colors) IN Layer 2 AT THE BEGINNING OF THE 19th CENTURY
Fresh water head (WHITE contour LinEs) andsalt water percentage (colors) IN N-S CrOSS SECTION (CoLumn 85) IN THE BEGINNING OF THE 19th CENTURY
CONCLUSIONS Tidal fluctuations on the shore and on the banks of the estuary result in inverse density distributions Shapes of these inverse density distributions depend on slope of shore or bank and on the heterogeneity of phreatic aquifer During silting up of estuaries these inverse distributions became entrapped under the tidal flat area with a very slow GW flow (principally induced by density differences) Results show very interesting evolutions of inverse density distributions which need more detailled modeling These evolutions should be modelled more in detail in the future: – changes from one landscape into another (in sedimentologically well-founded events) - influence of discretization of space-time grid on evolutions of inverse density distributions