Download
1 / 2
20 likes | 30 Views
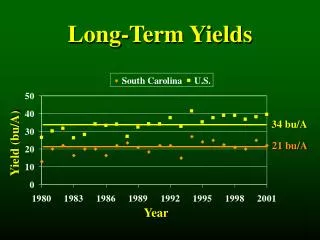
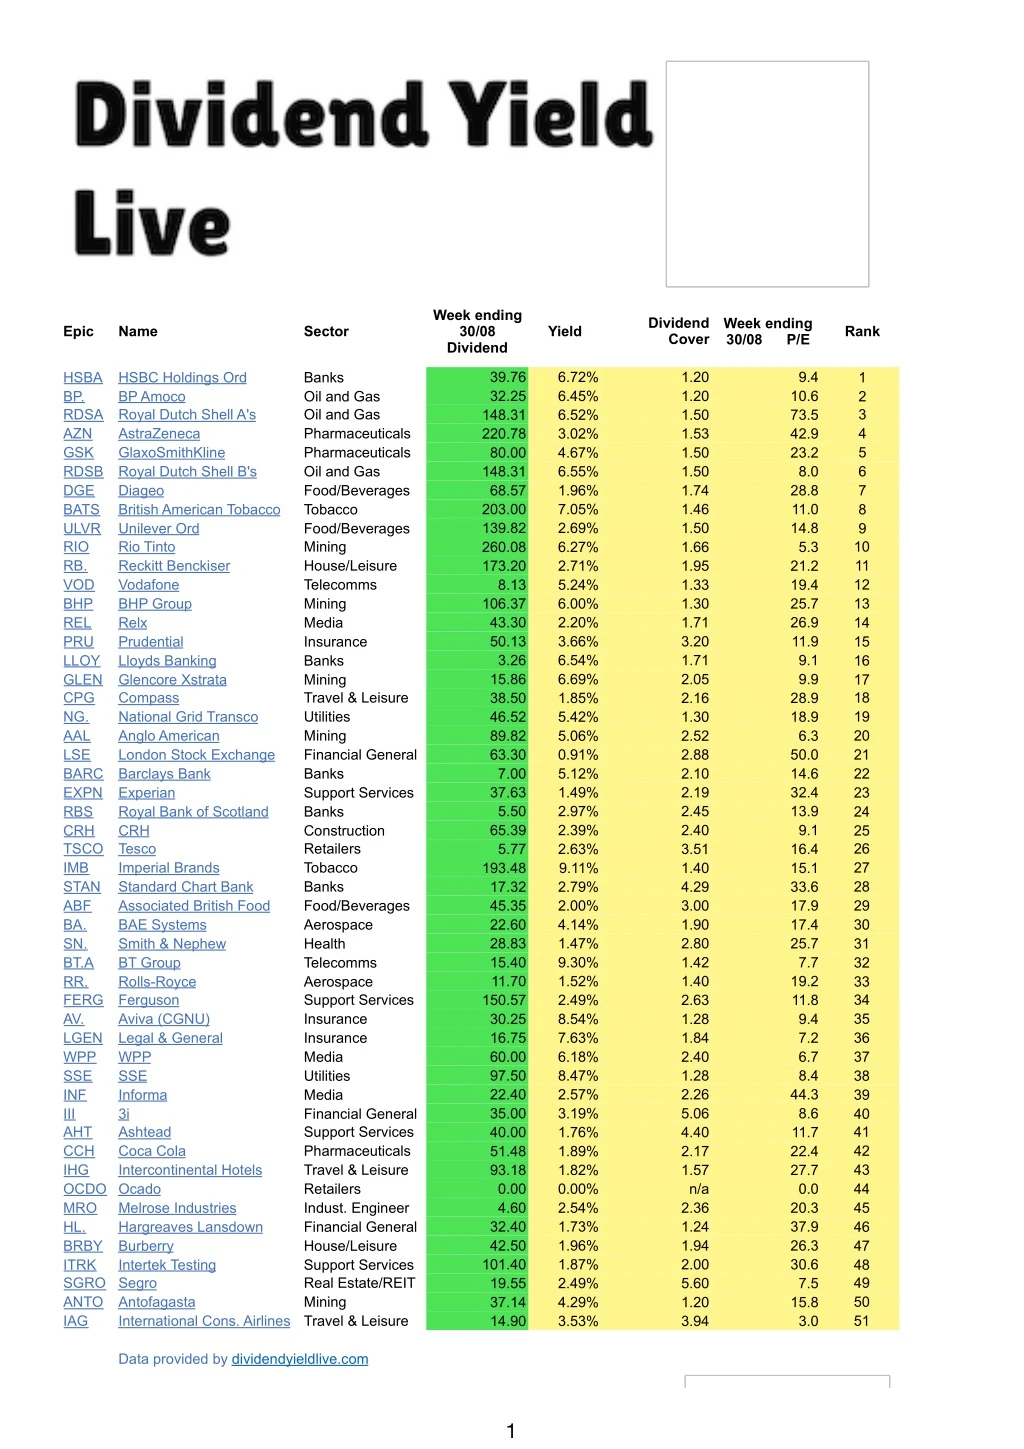
Dividend Yields for the FTSE 100 as at 31/08/19

E N D
Week ending 30/08 Dividend Dividend Cover Week ending 30/08 P/E Epic Name Sector Yield Rank 39.76 32.25 148.31 220.78 80.00 148.31 68.57 203.00 139.82 260.08 173.20 8.13 106.37 43.30 50.13 3.26 15.86 38.50 46.52 89.82 63.30 7.00 37.63 5.50 65.39 5.77 193.48 17.32 45.35 22.60 28.83 15.40 11.70 150.57 30.25 16.75 60.00 97.50 22.40 35.00 40.00 51.48 93.18 0.00 4.60 32.40 42.50 101.40 19.55 37.14 14.90 6.72% 6.45% 6.52% 3.02% 4.67% 6.55% 1.96% 7.05% 2.69% 6.27% 2.71% 5.24% 6.00% 2.20% 3.66% 6.54% 6.69% 1.85% 5.42% 5.06% 0.91% 5.12% 1.49% 2.97% 2.39% 2.63% 9.11% 2.79% 2.00% 4.14% 1.47% 9.30% 1.52% 2.49% 8.54% 7.63% 6.18% 8.47% 2.57% 3.19% 1.76% 1.89% 1.82% 0.00% 2.54% 1.73% 1.96% 1.87% 2.49% 4.29% 3.53% 1.20 1.20 1.50 1.53 1.50 1.50 1.74 1.46 1.50 1.66 1.95 1.33 1.30 1.71 3.20 1.71 2.05 2.16 1.30 2.52 2.88 2.10 2.19 2.45 2.40 3.51 1.40 4.29 3.00 1.90 2.80 1.42 1.40 2.63 1.28 1.84 2.40 1.28 2.26 5.06 4.40 2.17 1.57 n/a 2.36 1.24 1.94 2.00 5.60 1.20 3.94 9.4 10.6 73.5 42.9 23.2 8.0 28.8 11.0 14.8 5.3 21.2 19.4 25.7 26.9 11.9 9.1 9.9 28.9 18.9 6.3 50.0 14.6 32.4 13.9 9.1 16.4 15.1 33.6 17.9 17.4 25.7 7.7 19.2 11.8 9.4 7.2 6.7 8.4 44.3 8.6 11.7 22.4 27.7 0.0 20.3 37.9 26.3 30.6 7.5 15.8 3.0 HSBA BP. RDSA AZN GSK RDSB DGE BATS ULVR RIO RB. VOD BHP REL PRU LLOY GLEN CPG NG. AAL LSE BARC EXPN RBS CRH TSCO IMB STAN ABF BA. SN. BT.A RR. FERG AV. LGEN WPP SSE INF III AHT CCH IHG OCDO Ocado MRO HL. BRBY ITRK SGRO Segro ANTO IAG HSBC Holdings Ord BP Amoco Royal Dutch Shell A's AstraZeneca GlaxoSmithKline Royal Dutch Shell B's Diageo British American Tobacco Unilever Ord Rio Tinto Reckitt Benckiser Vodafone BHP Group Relx Prudential Lloyds Banking Glencore Xstrata Compass National Grid Transco Anglo American London Stock Exchange Barclays Bank Experian Royal Bank of Scotland CRH Tesco Imperial Brands Standard Chart Bank Associated British Food BAE Systems Smith & Nephew BT Group Rolls-Royce Ferguson Aviva (CGNU) Legal & General WPP SSE Informa 3i Ashtead Coca Cola Intercontinental Hotels Banks Oil and Gas Oil and Gas Pharmaceuticals Pharmaceuticals Oil and Gas Food/Beverages Tobacco Food/Beverages Mining House/Leisure Telecomms Mining Media Insurance Banks Mining Travel & Leisure Utilities Mining Financial General Banks Support Services Banks Construction Retailers Tobacco Banks Food/Beverages Aerospace Health Telecomms Aerospace Support Services Insurance Insurance Media Utilities Media Financial General Support Services Pharmaceuticals Travel & Leisure Retailers Indust. Engineer Financial General House/Leisure Support Services Real Estate/REIT Mining Travel & Leisure 1 2 3 4 5 6 7 8 9 10 11 12 13 14 15 16 17 18 19 20 21 22 23 24 25 26 27 28 29 30 31 32 33 34 35 36 37 38 39 40 41 42 43 44 45 46 47 48 49 50 51 Melrose Industries Hargreaves Lansdown Burberry Intertek Testing Antofagasta International Cons. Airlines Data provided by dividendyieldlive.com ?1
Week ending 30/08 Dividend Dividend Cover Week ending 30/08 P/E Epic Name Sector Yield Rank RTO NXT SMT SGE WTB HLMA EVR DCC BNZL SMIN PSON CCL BDEV ADM SDR PSN SLA SKG CRDA JD. AVV SPX MNDI LAND JMAT UU. RSA JE. FRES NMC BKG AUTO FLTR STJ SVT BLND ITV TW. RMV TUI SMDS PHNX HSX MRW SBRY KGF CNA DLG MCRO Micro Focus Int. MKS Marks & Spencer Rentokil Initial Next Scottish Mortgage Trust Sage Whitbread Halma Evraz DCC Bunzl PLC Smiths Industries Pearson Carnival Barratt Developments Admiral Schroders Persimmon Standard Life Aberdeen Smurfit Kappa Croda International JD Sports Aveva Spirax-Sarco Eng Mondi Land Secs Johnson Matthey United Utilities RSA Insurance Just Eat Fresnillo NMC Health Berkeley Auto Trader Group Flutter Entertainment St James's Place Severn Trent Water British Land ITV Taylor Wimpey Rightmove TUI Travel Smith (DS) Phoenix Holdings Hiscox Morrison Supermarket Sainsbury (J) Kingfisher Centrica Ord Direct Line Support Services Retailers Investments Tech/Software Travel & Leisure Electronics Mining Support Services Support Services Industrial General Media Travel & Leisure House/Leisure Insurance Financial General House/Leisure Insurance Industrial General Chemicals Retailers Tech/Software Indust. Engineer Basic Resources Real Estate/REIT Chemicals Utilities Insurance Retailers Mining Health House/Leisure Retailers Travel & Leisure Insurance Utilities Real Estate/REIT Media House/Leisure Media Travel & Leisure Industrial General Insurance Insurance Retailers Retailers Retailers Utilities Insurance Tech/Software Retailers 52 53 54 55 56 57 58 59 60 61 62 63 64 65 66 67 68 69 70 71 72 73 74 75 76 77 79 80 81 82 83 84 85 86 87 88 89 90 91 92 95 96 98 99 100 101 102 104 110 111 4.67 1.04% 2.78% 0.60% 2.38% 2.28% 0.80% 11.97% 1.98% 2.51% 2.69% 2.29% 4.57% 4.35% 4.26% 4.18% 12.35% 8.66% 3.56% 1.88% 0.28% 1.16% 1.28% 4.49% 5.91% 2.94% 5.07% 4.05% 0.00% 2.04% 0.72% 0.69% 1.26% 2.96% 5.25% 4.51% 6.13% 6.90% 5.23% 1.27% 7.96% 4.76% 7.23% 2.19% 3.61% 5.61% 5.56% 14.20% 7.49% 8.40% 7.23% 2.90 2.64 0.39 1.96 2.57 3.08 4.20 2.02 2.60 2.04 3.80 2.23 2.51 1.50 1.90 2.07 n/a n/a 2.30 16.60 2.92 2.52 2.50 1.30 2.60 1.13 1.60 n/a 1.62 8.00 67.60 3.13 1.21 1.25 1.43 1.10 1.90 3.40 2.82 1.80 2.40 1.43 1.08 2.00 2.00 2.01 0.90 1.58 1.73 1.49 32.7 13.7 319.8 26.1 37.9 44.0 2.9 25.1 20.4 24.2 11.1 7.7 9.6 15.7 15.0 6.7 8.6 14.0 25.9 23.0 177.6 26.7 9.5 15.9 13.7 15.3 16.5 64.3 15.1 21.5 7.1 26.2 28.0 28.1 15.5 11.7 10.4 7.4 30.7 6.6 17.0 9.8 34.4 17.8 21.8 19.2 21.0 8.5 6.4 91.6 165.00 3.13 16.64 99.70 15.71 59.41 138.35 50.50 44.85 19.00 157.74 27.50 91.40 114.00 235.00 21.60 90.41 88.50 1.71 43.00 103.00 71.76 45.85 85.50 41.28 21.20 0.00 15.07 18.10 27.20 6.70 200.00 48.22 93.37 31.23 8.00 7.64 6.80 65.03 16.20 46.80 33.89 6.60 11.00 10.82 9.90 21.20 93.17 13.90 Data provided by dividendyieldlive.com ?2