Download
1 / 8
100 likes | 284 Views
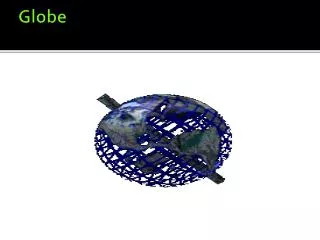
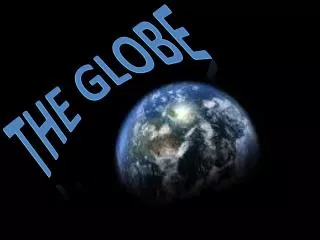
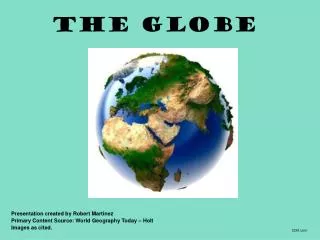
Globe Basics. What is a Globe? Best most accurate way to show the round earth, a sphere. Information about globes. Hemisphere: half sphere, half earth (northern, southern, eastern, western) Latitude: the imaginary lines running east and west parallel around the globe

E N D
Globe Basics • What is a Globe? • Best most accurate way to show the round earth, a sphere
Information about globes • Hemisphere: half sphere, half earth (northern, southern, eastern, western) • Latitude: the imaginary lines running east and west parallel around the globe • Equator: the starting latitudinal line that is equidistance from both poles and separates the northern and southern hemisphere
Information about globes (con’t) • Longtitude: the imaginary lines running from pole to pole (aka Meridians) • Prime Meridian: the starting longitudinal line that separates the eastern and western hemispheres
Maps • Map • A flat representation of the information on a globe
Information about maps • Scale: shows the relationship between map measurements and actual distance • Compass Rose: shows where the cardinal directions (North, South, East, West) are positioned • Map Key: explains the lines, symbols, and colors used on the map
Graphs, Charts and Diagrams • Graphs, Charts and Diagrams • A way of summarizing and presenting information visually
Graphs, Charts and Diagrams • Bar: compares data visually • Line: shows change over time • Circle: shows how the whole of something is divided into parts • Tables: present related facts and numbers in an organized way
Graphs, Charts and Diagrams (con’t) • Flow Charts: shows the order of how things happen or how they are related to each other • Diagrams: drawings that show steps in a process, point out the parts of an object, or explain how something works