Download
1 / 38
400 likes | 663 Views
The measurement of Innovation. An historical perspective The “Frascati Manual” and the “Oslo Manual” S&T indicators Innovation indicators Some evidence from innovation surveys Concluding remarks. Development of indicators. The linear model. Research-based Sequential Tecnocratic.

E N D
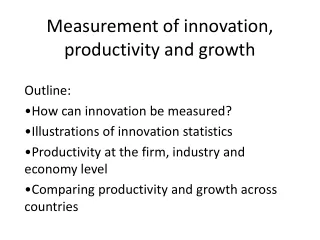
The measurement of Innovation • An historical perspective • The “Frascati Manual” and the “Oslo Manual” • S&T indicators • Innovation indicators • Some evidence from innovation surveys • Concluding remarks
The linear model • Research-based • Sequential • Tecnocratic
“Communities of practice” Research Knowledge Technology platforms Potential Markets Invention/ analytical design Detailed design & Test Re-design & Production Distribution & market BUS “The Chain Link Model” Chain Linked Model of Innovation Kline & Rosenberg
Definition of research and development (Frascati Manual) • R&D is defined as creative work undertaken on a systematic basis in order to increase the stock of knowledge including knowledge of man, culture and society, and the use of this stock of knowledge to devise new applications.
Technological innovation(Oslo Manual) • Technological innovations comprise new products and processes and significant technological changes of products, services and processes. • An innovation has been implemented if it has been introduced on the market (product and service innovation) or used within a production process (process innovation).
Technological innovation(Oslo Manual) • Innovations involve a series of scientific, technological, organisational, financial and commercial activities. • The product or process should be new (or rignificantly improved) to the firm (it does not necessarily have to be new to the relevant market)
Science and technology indicators • S&T indicators may be defined as a series of data designed to answer questions about: - the state of the science and technology enterprise, - its internal structure, - its relationships with the outside world, and - the degree S&T is meeting the goals set it, and about its evolution.
Science and technology indicators • Statistical data are the basic elements (atoms) with which indicators (molecules) are constructed. • The questions indicators have to answer concern aspects which can be tacked using quantitavive techniques.
Science and technology indicators • R&D • Patents • Bibliometrics • Technological balance of payments • Human resources for S&T • Trade in high-tech products
Resources: Scale vs Intensity R&D Expenditure (OECD) 0,04 Sweden 0,035 0,03 Japan Finland US France 0,025 the Netherlands Germany Denmark Intensity- Share of GDP spent on R&D 0,02 UK Belgium Ireland 0,015 Austria Italy 0,01 Portugal Spain 0,005 Greece 0 100 1000 10000 100000 1000000 Scale- Total Expenditure in R&D ($PPP; logarithmic scale)
Scientific and technological capacities in OECD Fonte: Caracostas & Muldur (1998)
Main indicators from innovation surveys • Number of innovating firms • by sector • by firm size • Cost of innovation • Percentage of sales due to new products
The Community Innovation Survey (CIS)The harmonised EU/OECD questionnaire • General information about the firm • Type of innovation (product, process) • Sources of information for innovation • Objectives of innovation • Factors hampering innovation • Cost of innovation • Impact of innovation
Innovation in EU source: Community Innovation Survey, OCT-PT
The Community Innovation Survey (CIS)The harmonised EU/OECD questionnaire • R&D • Cooperation in innovation • User sector of innovation • Public policies for innovation • Impact of innovation on employment, the environment, firm’s organisation
Innovative firms in manufacturing and services in Italy (1990-92) Institute for Studies on Scientific Research and Documentation National Research Council of Italy
Objectives of innovation Manufacturing in Italy1994-96(percentage of firms for which the factor is very relevant) Institute for Studies on Scientific Research and Documentation National Research Council of Italy
Obstacles to innovation Manufacturing in Italy1994-96(percentage of firms for which the factor is relevant) 42 Institute for Studies on Scientific Research and Documentation National Research Council of Italy
Sources of information for innovation Manufacturing in Italy1994-96(percentage of firms for which the factor is relevant) Institute for Studies on Scientific Research and Documentation National Research Council of Italy
Innovating firms in manufacturing in Italy (1994-96) Institute for Studies on Scientific Research and Documentation National Research Council of Italy
Cost of innovation (percentage) - Italy (1990-92) Institute for Studies on Scientific Research and Documentation National Research Council of Italy
R&D Design Know-how Software Training Marketing Investment 13.8 18.5 12.7 52.2 28.9 12.2 53.8 Service firms which have carried out innovation activities in Italy 1993-1995 (percentage) Institute for Studies on Scientific Research and Documentation National Research Council of Italy
R&D 13.8 Design 18.5 Know-how 12.7 Software 52.2 Training 28.9 Marketing 12.2 Investment 53.8 Total - 23.7 8.1 3.5 14.1 2.6 1.9 46.0 100.0 Innovation activities of service firms (percentages) Innovation expenditure Firms which have carried out the activity Institute for Studies on Scientific Research and Documentation National Research Council of Italy
Innovation expenditure of Italian service firms Institute for Studies on Scientific Research and Documentation National Research Council of Italy
R&D 23.7 Design 8.1 Know-how 3.5 Software 14.1 Training 2.6 Tooling-up, patents - Marketing 1.9 Investment 46.0 Total 100.0 35.8 7.4 - - - 8.1 1.5 47.2 100.0 Innovation expenditure (percentages) Service firms (1993-95) Manufacturing firms (1990-92) Institute for Studies on Scientific Research and Documentation National Research Council of Italy
Germany 83 Austria 81 Ireland 79 Finland 69 Spain 53 Italy 50 Poland 34 Turkey 33 82 64 62 46 - 31 - - Lessons from the CIS survey (1994-1996) Percentage of innovating firms Manufacturing firms Service firms Institute for Studies on Scientific Research and Documentation National Research Council of Italy
Innovation can be measured We have learnt a lot from innovation surveys and other indicators Still many challenges ahead of us Concluding remarks
Lessons learned • Technological innovation is quite a diffused phenomenon • There are wide differences across sectors and size of firm • Firms rely on a wide range of innovation sources: investment, R&D and software are the major components of firms' innovation expenditure
Lessons learned • Major obstacles for introducing technological innovation are of an economic nature - i.e. cost and risk too high • Technological information is drawn mainly from outside suppliers of equipment, materials and components as well as from in-house technical departments • Internal sources of information are much more important than public research institutions
Software Services Organisation Information and communication technologies Biotechnologies Employment Environmental sustainability Some challenges
Growth of Knowledge-based industries 14 Korea 12 10 8 Average Annual Real Value Added Growth of Knowledge Based Industries (1985-share year) Portugal** 6 UK* Denmark 4 Japan Mexico Austria Germany Canada NL* Greece* Spain*** US Italy France Belgium Sweden*** 2 Norway Denmark 0 0 10 20 30 40 50 60 Share in Business Sector Value Added of Knowledge Based Industries (share year 1996 except: *1995;**1993; ***1994) OECD(2000)
Portugal Japan Netherlands Spain Ireland Austria Mexico Norway Italy Sweden Finland Germany Canada UK Iceland Belgium France Switzerland Denmark Korea US Australia -0.2 -0.15 -0.1 -0.05 0 0.05 0.1 0.15 0.2 Change in the Amount of Tax Subsidies for 1 US Dollar of R&D Incentives to BERD1990-1998 SOURCE: OCDE (1999).
Some challenges • Further development of theories in the knowledge-based economy • Innovation surveys allow to take into account complexity • Linkage with other industrial data • Risk of too much information • The advantage of international comparability (“Big science”)