Download
1 / 2
20 likes | 128 Views
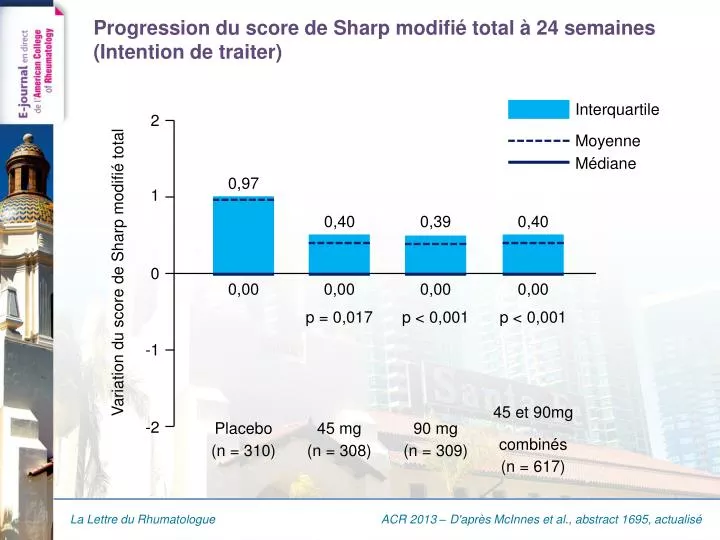
Progression du score de Sharp modifié total à 24 semaines (Intention de traiter ). Interquartile. ACR 2013 – D'après McInnes et al., abstract 1695, actualisé. 2. Moyenne. Médiane. 0,97. 1. 0,40. 0,39. 0,40. Variation du score de Sharp modifié total. 0. 0,00. 0,00. 0,00.

E N D
Progression du score de Sharp modifié total à 24 semaines (Intention de traiter) Interquartile ACR 2013 – D'après McInnes et al., abstract 1695, actualisé 2 Moyenne Médiane 0,97 1 0,40 0,39 0,40 Variation du score de Sharp modifié total 0 0,00 0,00 0,00 0,00 p = 0,017 p < 0,001 p < 0,001 -1 45 et 90mg combinés(n = 617) -2 Placebo(n = 310) 45 mg(n = 308) 90 mg(n = 309)
Progression du score de Sharp modifié total à 52 semaines (Intention de traiter) 1,4 ACR 2013 – D'après McInnes et al., abstract 1695, actualisé 1,2 1,0 0,8 Variation moyenne depuis l’inclusion 0,6 0,4 0,2 0 Semaine 0 Semaine 24 Semaine 52 Placebo (n = 310) Placebo → 45mg à S24 (n = 269)* UST 45 mg (n = 308) UST 90 mg (n = 309) *Patients ne recevant pas l’UST sont exclus