Download
1 / 67
680 likes | 878 Views
Early identification and prevention of difficulties of learning to read Heikki Lyytinen, Agora Human Technology Center & Dept . of Psychology University of Jyväskylä & Niilo Mäki Institute, Jyväskylä, Finland. For more : heikki.lyytinen.info ; see also : www.graphogame.com.

E N D
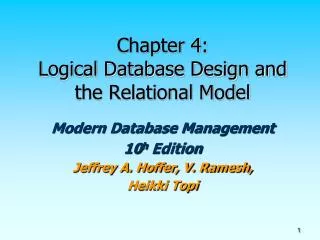
Early identification and prevention of difficulties of learning to read Heikki Lyytinen, Agora Human Technology Center & Dept. of PsychologyUniversity of Jyväskylä & Niilo Mäki Institute, Jyväskylä, Finland For more: heikki.lyytinen.info; seealso: www.graphogame.com DenSjundeNordiskaKongressenomDyslexipedagogik, 15. August, 2014, Stockholm
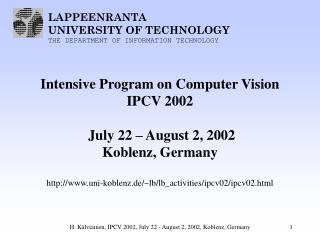
Development of Nonword Reading accuracy during 1st Grade(Scottish data up to 2nd grade) COST A8 results, 1998
36 100 36 100 80 Percent correct Percent correct 27 75 27 60 18 50 18 # of correct answers # of correct answers 40 9 25 9 20 0 0 0 0 1.week +10 week. Last week/1gr. 1.week +10 week Tlaskweek +5 week +15 week +5 week +15 week The averagedevelopment Individualdevelopment The development of reading accuracy (% correct) during the 1. grade in Finland Aro et al., 2004
The Jyväskylä Longitudinalstudy of Dyslexia (JLD): An intensivefollow-up of children at familialrisk for dyslexiafrombirth Jyväskylä Longitudinalstudy of Dyslexia (JLD) & Graphogame > Graphogame (in Finland) Ekapeli/Graphogame (ks.www.lukimat.fi; www.graphogame.com): MikkoAro, Jane Erskine, SiniHintikka/Huemer), RitvaKetonen, JanneKujala, Juha-MattiLatvala, Emma Ojanen, MikkoPitkänen, MiiaRonimus, NiinaSaine, Ulla Richrdson Learning game programmers: IivoKapanen, Ville Mönkkönen, MiikaPekkarinen > JLD 1994- *Mikko Aro, *Timo Ahonen, Kenneth Eklund, Tomi Guttorm, *Leena Holopainen, Jarmo Hämäläinen, Ritva Ketonen, *Marja-Leena Laakso, Seija Leinonen, *Paavo Leppänen, ^Matti Leiwo, *Marja-Kristiina Lerkkanen, Kaisa Lohvansuu, ^Paula Lyytinen, Anna-Maija Oksanen, Kurt Muller, *Anna-Maija Poikkeus, Anne Puolakanaho, *Ulla Richardson, Paula Salmi, *Asko Tolvanen, *Minna Torppa, Helena Viholainen SupportedbyEU, Niilo Mäki Foundation, The Academy of Finland, Univ.of Jyväskylä ,Tekes, RAY, Ministry of ForeignAffairs/ Education of Finland, Nokia Oy, Kone Oy, Wärtsilä Oy, Kela, The FinnishCulturalFunds
..when biological factors compromise reading acquisition.. Somethingrelevantwelearnedfrom the Jyväskylä Longitudinalstudy of Dyslexia (JLD)– a follow-upfrombirth to puberty of children at familialrisk for dyslexiaThe JLD researchgroupCoE of Learning and Motivation Research, Academy of FinlandDepartment of Psychology, University of Jyväskylä
The goals of the JLD • to identify (from children at familial risk for dyslexia) • precursors of dyslexia • predictors of compromised acquisition • developmental paths leading to dyslexia • The last step: the development of preventive measures
AT -RISK GROUP N=108 children CONTROL GROUP N=92 children Number of children who have attended the last originally agreed assessment phase at the 3rd grade Born at the hospitals of Central Finland during 01.04.93-31.07.96 N= 9368 infants I Screening II Screening III Screening Short questionnaire administered at the maternity clinics N=8427 parents Compre-hensive questionnaire N=3146 parents AT -RISK GROUP N=117 infants Assessment of parents’ reading and spelling skills N=410 parents CONTROL GROUP N=105 infants VII grade VIII grade IX grade II grade III grade 14 month I grade Neo- natal 6 month 18 month 2 years 2½ years 3½years 4½ years 5 years 5½years 6½years N = 85 N = 101 N = 88 N = 108 N = 108 N = 107 N = 107 N = 107 N = 107 N = 107 N = 107 N = 107 N = 107 N = 112 N = 108 N = 108 N = 107 N = 66 N = 81 N = 76 N = 92 N = 93 N = 96 N = 94 N = 95 N = 93 N = 93 N = 93 N = 92 N = 92 N = 96 N = 94 N = 94 N = 95 N = 1452 N = 2641 N = 1756 N = 1705 N = 1549 CLASSMATES
Children with reading disability 1st gr 2nd gr 3rd gr 8th gr At risk group N = 36 N = 42 N = 38 N = 38 N=108 1st gr 2nd gr 3rd gr 8th gr Control group N = 10 N = 12 N = 9 N = 10 N=92
The reading status of childrenbornat familialrisk for dyslexiaat schoolage • Expectation of the geneticinfluences • > almost 1/2 affected (due to 1 parent’sdyslexia) • The observedresult: 33 fullfilled the criteria • compromisedinitialreadingacquisition42 / 107 • severe, persistentreadingdisorder 26 / 107
SPEECH PERCEPTION, COMPREHENSION,PRODUCTION • Auditory discrimination • Phonological processing • Vocalization • Vocabulary, Morphology, Syntactic skills • CHILD’S CHARACTERISTICS • Attention • Psychophysiological • Temperament • INTERVENTION • Phonological • Naming • Family School • NEUROPSYCHO- • LOGICAL FUNCTIONS • Visuo-spatial skills • Articulation, Motor Skills • COGNITION • IQ, Memory • Associative learning ASSESSMENT DOMAINS • HOME ENVIRONMENT • Parent-child interaction • Print exposure • Parenting, Stress • ACHIEVEMENT • Alphabetic skills • Reading & Spelling • Math skills
IDENTIFYING & PREDICTING RISK a summary of significant measures P = Predictors D = Differences between groups AgeVariable 7 - yrs Reading accuracy & speed D 5 - yrs Naming speed P & D 4 - 6 yrs Phonological manipulation P & D 5 - 6 yrs Letter knowledge P & D 5 - yrs Verbal memory P & D 3 - 6 yrs Phonological sensitivity P & D 3 - 5 yrs Inflectional skills P & D 2 - 3 yrs Articulation accuracy P 2 yrs Maximum sentence length P & D 6 mth Speech perception P& D Birth ERP to speech sound P& D Lyytinen et al., Annals of Dyslexia, 2004; Dyslexia, 2004; Sage Handbook of Dyslexia, 2008
L i f e w e e k s Childrenwith and Withoutfamilialrisk for dyslexiadonot differ 50 40 Age (ordinalnumber of weeks of life) 30 20 At-risk group 10 Control group 0 1 2 3 4 5 6 7 8 9 10 11 1. Vocalizations which resemble sounds 2.Sustainedvocalization Milestones of vocaldevelopment 3.Cooing-likevocalization 4. Sustained vocalization with pauses 5. Two kinds of vocalizations 6. Imitates parents’ vocalization 7. Initiates redublicated babbling 8. Combines two different syllables 9. Uses gestures 10. Parallel pointing and vocalization when wants something 11. Uses word-like expressions Vocalization
L L i i f f e e w w e e e e k k s s 60 50 50 40 40 30 30 20 20 At-risk group At-risk group 10 10 Control group Control group 0 0 1 2 3 4 5 6 7 8 9 10 11 12 13 14 15 1 2 3 4 5 6 7 8 9 10 11 12 1. Both fists tightly clenched 1. Raises head 2. Palmar grasp: holds finger tightly 2. Turns head towards parents 3. Holds fists open or slightly clenched 3. Rolls from stomach to back 4. Rolls from back to stomach 4. Reaches with a half-open hand 5. Crawls: stomach in contact with floor 5. Plays with hands 6. Sits alone by taking support with hands 6. Brings toy to mouth 7. Sits alone without support 7. Reaches for an object to touch 8. Raises self into a sitting position 8. Grasps an offered object 9. Crawls on hands and knees 9. Transfers an object from hand to hand 10. Pulls to stand by furniture 10. Holds two objects at same time 11. Moves around by holding onto furniture 11. Beginning thumb-forefinger grasp 12. Walks alone 10-15 steps 12. Drops an object intentionally 13. Pincer grasp: straight forefinger & thumb 14. Bangs two objects together 15. Advanced pincer grasp: bends fingers Gross Motor Fine Motor
Phonemic lenghtin Finnishand dyslexia: summary • Alteration of the duration of a phoneme changes the meaning • > kuka(who) – kukka(flower); mato(worm) – matto(carpet); tuli(fire) – tuuli(wind) • No concomitant change of e.g. stress or pitch • Well defined in orthography (long=doubling the letter) • Finnish dyslexic readers make a disproportionately high number of • quantity-related errors when reading or spelling unfamiliar words • > noted also in English (Steffens, et al. 1992, /sa/ to /sta/) • Hypothesis: dyslexia may involve a difficulty in categorizing speech sound according to sub-phonemic features such as duration • For details, see Lyytinen, et al. (2003)
CONSONANT DURATION CHANGE: BEHAVIORAL CONDITIONED HEAD-TURN EXPERIMENT • The original stimulus taken from the speech of a female producing the pseudoword /ata/ • Duration of the silent closure stage of the word (medial dental stop, the /t/-sound) augmented in stepwise fashion • Increments: 20 ms • Total duration: 300 - 460 ms • The impression of the perceived stimulus shifted from ata to atta Richardson et. al., 2004, Developmental Neuropsychology
The mean percentage of atta-categorizations in 6-month-old infants with high familial risk for dyslexia and control infants The groups differ in their responses to /ata/4 (x2 = 23.32, p = .0000) At-risk infants require longer /t/ (silent gap) duration to categorize the stimulus as /atta/ Richardson et. al., 2003 Developmental Neuropsychology .
2 vuotta 2.5 vuotta Riskiryhmä Verrokkiryhmä 3.5 vuotta Ryhmäerot merkitseviä vaikka ÄO kontrolloitu Skaala: Z-arvot verrokkiryhmän keskiarvon ja hajonnan pohjalta määritettynä 5 vuotta
At 6-month of age-ERPs to /ata/ - /atta/ ERP difference waves between responses to repeated standard and infrequently presented deviant /ata/s. Note that the deflection of negative polarity called mismatch negativity (MMN) is present in both groups in the right hemisphere but is clearly smaller in the left hemisphere among at- risk children (see Leppänen & Lyytinen, 1997; Leppänen et al. 2002).
DevelopmentaldifferencesbetweenJLD at-riskchildrenwith (N=37) and without (N=66) readingimpairement DevelopmentalskillObservedp’s and powers of the differences Expressivelanguage 1.5y .001 .78 Expressivelanguage 2.5y .027 .61 Verbalshort-termmemory 3.5y .010 .74 Verbalshort-termmemory 5.0y .016 .68 Verbalshort-termmemory 6.5y .001 .92 Morphology 5.0y .024 .62 Phonology 4.5y .006 .80 Phonology 5.5y .001 .93 Phonology6.5y .002 .88 Letterknowledge 4.5y .003 .85 Letterknowledge 5.0y .000 .98 Letterknolwedge 5.5y .003 .85 Letterknolwedge 6.5 .000 .98 Rapidnaming 5.5y .000 .97 Rapidnaming 6.5y .000 .99 Verbal IQ 8.5y .004 .83 Lyytinen et al., 2008
Is reading acquisition associated with early language delays? • Late talking – delay in the development of expressive language skills (assessed here at 2 years of age) • Similar numbers of children in both groups could be defined as late talkers • Do children with normal speaking at 2.5 years age differ from those who start speaking later (after 2.5 y of age) in their later language development? • If so how? • Is late talking connected to reading acquisition • If so how?
Late talkers Not late talkers Late talkers Not late talkers Age (years) Development of language skills among late talkers of the risk and control groups 1.0 At-risk Controls 0.5 0 Z-score composite of language skills -0.5 -1.0 -1.5 2 3 1/2 5 2 3 1/2 5 Lyytinen P. et al., J. of Speech, Language & Hearing Res;2001
Development of receptive and expressive language skills by late-talking groups Receptive Expressive 0.5 0 Mean z-score composite -0.5 -1.0 -1.5 -2.0 2.5 3.5 5.5 2.5 3.5 5.5 Age (years) Lyytinen, P. et al., Annals of Dyslexia, 2005, 55, 2, 166-192. Late talkers1 at risk group (expressive delayed, N=10) Late talkers1 at control group (expressive delayed, (N=10)) Late talkers2 at risk group (receptive and expressive delayed, N=12) Late talkers2 at control group (receptive and expressive delayed, N=3)
Remainder of the control group Remainder of the at-risk group Late talkers1 control group (expressive delayed) Late talkers2 control group (receptive and expressive delayed) Late talkers1 at-risk group (expressive delayed) Late talkers2 at-risk group (receptive and expressive delayed) Reading accuracy and speed by groups at the end of the first grade 1,5 1 0,5 0 Mean z-score composite -0,5 -1 -1,5 -2.0 Remainders of the groups Control group At-risk group Late-talking groups Lyytinen, P. Eklund & Lyytinen, Annals of Dyslexia, 2005, 55, 2, 166-192.
Remainder of the control group Remainder of the at-risk group Late talkers1 control group (expressive delayed) Late talkers2 control group (receptive and expressive delayed) Late talkers1 at-risk group (expressive delayed) Late talkers2 at-risk group (receptive and expressive delayed) Spelling skills by groups at the end of the first grade 1,5 1 0,5 Mean z-score composite 0 -0,5 -1 -1,5 -2.0 Remainders of the groups Control group At-risk group Late-talking groups Lyytinen, P. Eklund & Lyytinen, Annals of Dyslexia, 2005, 55, 2, 166-192.
Remainder of the control group Remainder of the at-risk group Late talkers1 control group (expressive delayed) Late talkers2 control group (receptive and expressive delayed) Late talkers1 at-risk group (expressive delayed) Late talkers2 at-risk group (receptive and expressive delayed) Reading comprehension by groups at the end of the first grade 1,5 1 0,5 0 -0,5 -1 -1,5 -2.0 Remainders of the groups Late-talking groups Lyytinen, P. Eklund & Lyytinen, Annals of Dyslexia, 2005, 55, 2, 166-192.
The letter knowledge of 3.5-6.5 year olds (JLD) and reading acquisition Lettter names known Reading acquisition fails during 1. grade 30 25,41 25 Reading acquisition normal during 1. grade 20 16,59 15 14,03 13,57 10,41 10 6,21 5 3,74 3,09 2,68 0,85 0 Lyytinen et al., (2007) Nordic Psychology 3.5 4.5 5 5.5 6.5 Age (years)
The JLD-follow-upfrombirth to schoolage of reading-relateddevelopment Receptive speech, 2.5 y. Pseudoword repetition, 3.5 y. Phonological skills, 3.5 y. Phonological skills, 4.5 y. Phonological skills, 5.5 y. Rapid naming, 5.5 y. Rapid naming, 6.5 y. Letter knowledge, 3.5 y. Letter knowledge, 4.5 y. Letter knowledge, 5 y. Letter knowledge 5.5 y. IQ, 5 y. Lyytinen, et al. Scand. J. of Psychology, 2009. Reading composite, 1. gr. Reading composite 2. gr. -3 -2 -1 0 1 z-score (mean = 0, sd =1) Individual profiles of the prediction measures of the JLD children whose reading acquisition was most severely compromised
Observing developmental routes to dyslexia • Predictivedomains, assessmentagesfrom 1-6.5 y Alpha* • Receptivelang. 12,14,18mo, 2.5, 3.5, 5.0 y .78 • Expressivelang.12,14,18 mo,2.0, 2.5, 3.5, 5.5 y .93 • Morphology 2.5, 3.5, 5.0 y .76 • Verbalshorttermmemory 3.5, 5.0, 5.5, 6,5 y .75 • Rapidserialnaming 3.5, 5.5, 6.5 y .89 • Letterknowledge 3.5, 4.5,5.0, 6.5 y .72 • Phonologicalskills 3.5, 4.5, 5.5, 6.5 y .82 • IQ 5.0 • Outcomemeasuresused as a composite of the followingmeasures: Readingaccuracy (Aug.,Jan.,May), Fluency (Aug.,Dec.,April,May/1 gr, Nov/2.gr), Spelling (Dec., Apr,/1.gr Nov/2.gr) and Comprehension(Apr./1gr. And Nov/2.gr) Lyytinen et al., Merrill-PalmerQuarterly, 2006
Profiling of the subgroups of the reading related developmental differences • Method: Latentprofileanalysis – variances set as equalbetweengroups • Program: MPLUS (includingimputing the missing data) • Estimationmethod: Maximumlikelhoodparametersestimateswithrobuststandarderror • Criterion: Bayesianinformationcriterion • N=199
1,00 0,50 0,00 -0,50 -1,00 -1,50 1 2,5 3,5 5 1,5 2 3,5 5,5 2,5 3,5 5 3,5 4,5 5,5 6,5 3,5 4,5 5 5,5 6,5 3,5 5 6,5 3,5 5,5 6,5 7,0 -8,0 Receptive Expressive Phonological skills Letter knowledge Memory Rapid naming Reading skills Inflectional skills speech speech Phonol.impairm. Typical Naming dysfluency Unexpected Subgroup members’ average performance across ages 1-6 years in the seven skill domains. Declining (phonological) N=35 (11risk+3controls with dyslexia);Typical N=85 (11r+4c);Naming dysfluency N=12 (8r+1c);Unexpected N=67 (14r+8c). Lyytinen et al., Merrill-Palmer Quarterly, 2006
Predictingreadingfluency Phonologicalawareness 1stGrade, 7.5 years Reading accuracy 1st to 3rdGrade 7 to 9 years .55 Letterknowledge 4.5 to 6.6 years .81 .24 Reading fluency 8thGrade, 15 years .52 .52 RapidNaming 5 to 6.5 years .27 CFI= 0.98 TLI=0.98 RMSEA=.043, SRMR=.036 chi= 112.063 (df=82), p=.004 N=200 R2=49.5%
.60 .59 Reading 6.5 y (R2=.36) Letter know. 4.5 y (R2=.09) Letter know. 5.5 y (R2=.69) Effects of the environment .30 .47 .18 .43 .33 (a) model for At-risk group: shared reading associated with vocabulary development (Torppa et al., 2007) 4.5 y 1 0 Phon awareness Level (R2=.24) Phon awareness Trend 1 1 5.5 y 2 1 .48 6.5 y .33 .59 Vocabulary 3.5 y (R2=.11) Rec. .54 Vocabulary 5 y (R2=.65) Rec. .57 1 1 Exp. Exp. .57 .33 .26 4 y 5 y 6 y HLE and interest 1 .12 1 1 Reading interest, 2 y .22 Reading interest Level (R2=.42) .49 .26 .20 .50 Shared reading, 2 y Shared reading Level (R2=.43) Father’s education .38 .38 1 1 1 .17 4 y 5 y 6 y .44 Father’s reading model Mother’s education Mother’s reading model .27 Access to print Level (R2=.34) 1 1 1 4 y 5 y 6 y
For more details, please, see.. Torppa, M., Poikkeus, A.-M., Laakso, M.-L., Leskinen, E., Tolvanen, A., Leppänen, P. H. T., Puolakanaho, A., Lyytinen, H. (2007). Modeling the early paths of phonological awareness and factors supporting its development in children with and without familial risk for dyslexia. Scientific Studies of Reading, 11(2), 73-103. Torppa, M., Poikkeus, A.-M., Laakso, M.-L., Eklund, K., and Lyytinen, H. (2006). Predicting delayed letter name knowledge and its relation to grade 1 reading achievement in children with and without familial risk for dyslexia. Developmental Psychology, 42(6), 1128-1142. Torppa, M., Tolvanen, A., Poikkeus, A-M. Eklund, K., Lerkkanen, M-K., Leskinen, E., & Lyytinen, H. (2007). Reading Development Subtypes and Their Early Characteristics. Annals of Dyslexia, 57, 3-52.
Learninggame and researchenvironment for the acquisition of the basicreadingskill:Graphogamehelpslearning the connectionsbetweenspoken and writtenlanguage
Important facts about reading acquisition • Readingacquisition = learning to connect a spokenlanguage to itswrittenforms • Writtenlanguages (orthographies) vary in terms of howthisconnection-buildingcanbe made • New orthographiessuch as Finnish, Spanish and mostAfricanlanguagesareconsistent - the spokenlanguagehasnothadtime to changeafter the writtenlanguagehasbeenfixed to itspresentform
Reading acquisition and the consistency of the connections between spoken and written • If the reading instruction is organized optimally the time child needs for the acquisition of the basic reading skill is the shorter • the more consistent the connections are because no complexities/alternatives need to be learned • the smaller the number of connections one has to learn
The consistency of the writing system • In writingsystemssuch as that of Finnish, Spanish and Africanlanguages (with new orthographies) • the connectionsaremostlysymmetricallyconsistent at letter-phonemelevel, ie. eachletterrepresentsonlyonephoneme and eachphonemehasonlyoneletterrepresentingit; the connectionbuilding is 1 to 1, i.e.consistent to bothreading and writingdirections • thereforealso the number of connections is small (mostlylessthan 30, ie.thenumber of phonemes)
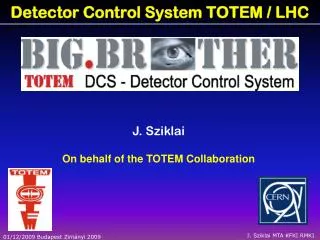
GraphogameThe task: Catch the letterthatmatches the soundyouhear! Competitor’s results Player’s results 9 0 Falling letters A E U Correctly chosen letters Mouse pointer Player’s catcher Competitor’s catcher For description of the Graphogame , see Lyytinen et al. Scand.J.ofPsychol. 2009, 50, 668-675.
How and where Graphogame works Appliesphonicsbydrillingconnectionsbetweenspoken and writtenitems; the writtenitemrepresenting the spokentarget is chosenfrom 2-8 alternatives Proceedsfromsmall to largerunits, fromletter-sounds to written and spokenwords Adaptsautomatically to individualskillslevel Itsuse is mostuncomplicated in transparentorthographiessuch as Finnish and Africanwritingsystemswhichhaveregularletter-soundconnections, 1 sound <=>1 letter
Exemplary learning curves of 4-8 year olds (N=726) The cumulative number of learned items Hours of playing Modelling: Janne Kujala
Remedial reading intervention and computer-assisted instruction (CARRI) (T1-T6) CARRI group (n=25) Follow-up 2 Screening test (N=166) Main- stream group (n=116) Subtest 2 Subtest 3 Subtest 4 Subtest 5 Post test Follow-up 1 IQEstimation RRI group (n=25) Remedial reading intervention (RRI) (T1-T6) T7 May Grade 2 T6 August Grade 2 T8 August Grade 3 T4 March Grade 1 T5 May Grade 1 T3 January Grade 1 Screening August Grade 1 Groupping September Grade 1 T1 October Grade 1 T2 December Grade 1 CARRI group = Computer assisted remedial reading intervention group Mainstream group = Mainstream reading instruction group RRI group = Remedial reading intervention group (=1/4 of the remedial reading support session) Saine et al., (2011) ChildDevelopment, 2011, 82, 1013-1028.
Successful preventive practice Massedpracticefollowingoptimalphonicsstrategyhelps at riskchildrenifnotstartedbefore 6.5y age >>played>1 x per day in subsequentdaysuntil the goal is reached • motivated to beused in an as ”active” form as possible • motivation to continue is guaranteedbyrewarding via experience of success (~80% correcttrials) • the role of parents: they show theyverymuchlikechildplays GG See: www.lukimat.fi(whereFinnishchildren play) http://www.lukimat.fi/lukimat-sv?set_language=svor (Swedish) graphogame.comfor description and demo in English
Challenges • Works without complications in consistent (gr>=<ph) orthographies • Warning: may ”condition” the stimulus-response connections too deeply to allow easy relearning of different associations when there are alternative connections. • Therefore, only consistent relations can be drilled without any risk of losing the necessary flexibility (alternation of associations) typical of inconsistent orthographies.
A mimimun set of single letter-sounds selected to a version of the game – list of their sounds present in > 5% of the occurrence of the letter in English text (Cedex databasis, among 17 million words) An example of the statistical approach to illustrate the problems associated with consistency (or the paucity of it) Letter % of different / all words(exemplary word) i 62.3 24076 3471217 I (in) 19.4 4386 1083446 aI (i) 5.1 2519 283459 (social) l 95.4 22272 2934160 l (all) d 94.4 14990 2844232 d (and) m 100.0 11176 1817206 m (from) b 99.0 7726 1169525 b (be)