1 / 6

Example - Identification of Priority Health Zones

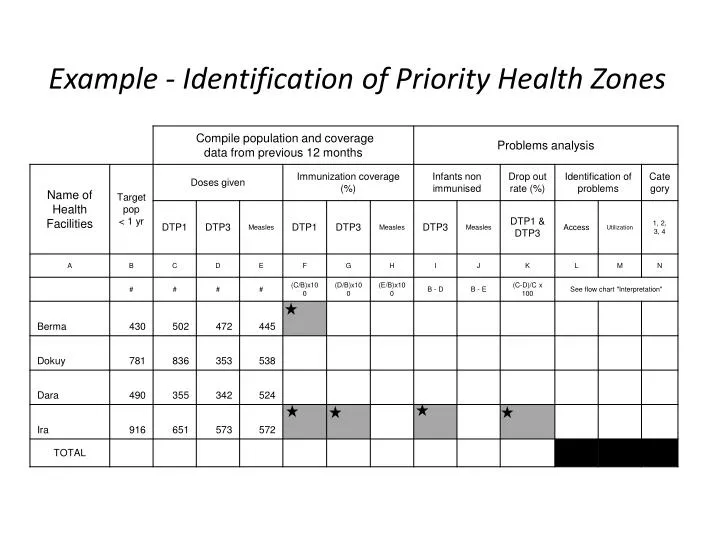
Example - Identification of Priority Health Zones. Example - Data for Monitoring Chart. Zorgho , 2003 Target population < 1 = 12,897. 12897. 11822. 10748. 9673. 8598. 7523. 6449. 5374. 4299. 3224. DTP1. 2150. 1075. DTP3. 0. 836. 836. 909. 1745. 818. 2563. 525. 525. 631.

dinos
Download Presentation

Example - Identification of Priority Health Zones

An Image/Link below is provided (as is) to download presentation Download Policy: Content on the Website is provided to you AS IS for your information and personal use and may not be sold / licensed / shared on other websites without getting consent from its author. Content is provided to you AS IS for your information and personal use only. Download presentation by click this link. While downloading, if for some reason you are not able to download a presentation, the publisher may have deleted the file from their server. During download, if you can't get a presentation, the file might be deleted by the publisher.

E N D

Presentation Transcript


  1. Example - Identification of Priority Health Zones

  2. Example - Data for Monitoring Chart • Zorgho, 2003 • Target population < 1 = 12,897

  3. 12897 11822 10748 9673 8598 7523 6449 5374 4299 3224 DTP1 2150 1075 DTP3 0 836 836 909 1745 818 2563 525 525 631 1156 539 1695 311 589 868 37 34 34

  4. Identification of Priority Health Zones

More Related