Download
1 / 57
570 likes | 686 Views
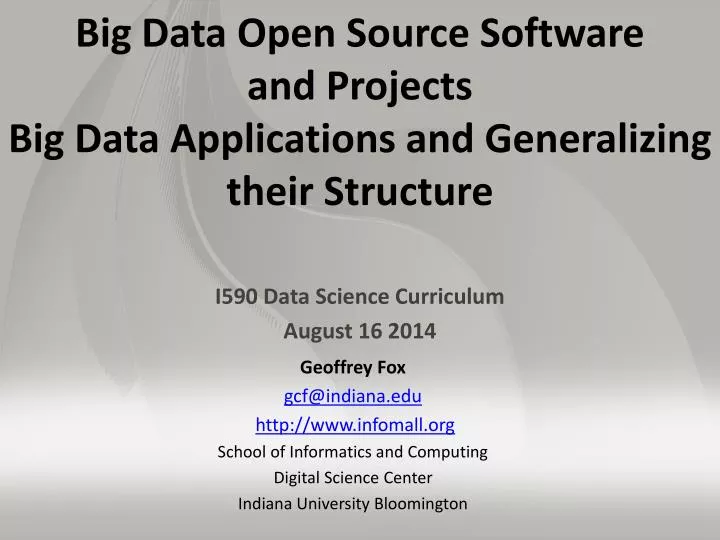
Big Data Open Source Software and Projects Big Data Applications and Generalizing their Structure. I590 Data Science Curriculum August 16 2014. Geoffrey Fox gcf@indiana.edu http://www.infomall.org School of Informatics and Computing Digital Science Center

E N D
Big Data Open Source Software and Projects Big Data Applications and Generalizing their Structure I590 Data Science Curriculum August 16 2014 Geoffrey Fox gcf@indiana.edu http://www.infomall.org School of Informatics and Computing Digital Science Center Indiana University Bloomington
51 Detailed Use Cases: Contributed July-September 2013Covers goals, data features such as 3 V’s, software, hardware • http://bigdatawg.nist.gov/usecases.php • https://bigdatacoursespring2014.appspot.com/course (Section 5) • Government Operation(4): National Archives and Records Administration, Census Bureau • Commercial(8): Finance in Cloud, Cloud Backup, Mendeley (Citations), Netflix, Web Search, Digital Materials, Cargo shipping (as in UPS) • Defense(3): Sensors, Image surveillance, Situation Assessment • Healthcare and Life Sciences(10): Medical records, Graph and Probabilistic analysis, Pathology, Bioimaging, Genomics, Epidemiology, People Activity models, Biodiversity • Deep Learning and Social Media(6): Driving Car, Geolocate images/cameras, Twitter, Crowd Sourcing, Network Science, NIST benchmark datasets • The Ecosystem for Research(4): Metadata, Collaboration, Language Translation, Light source experiments • Astronomy and Physics(5): Sky Surveys including comparison to simulation, Large Hadron Collider at CERN, Belle Accelerator II in Japan • Earth, Environmental and Polar Science(10): Radar Scattering in Atmosphere, Earthquake, Ocean, Earth Observation, Ice sheet Radar scattering, Earth radar mapping, Climate simulation datasets, Atmospheric turbulence identification, Subsurface Biogeochemistry (microbes to watersheds), AmeriFlux and FLUXNET gas sensors • Energy(1): Smart grid 26 Features for each use case Biased to science
13 Image-based Use Cases • 13-15 Military Sensor Data Analysis/ IntelligencePP, LML, GIS, MR • 7:Pathology Imaging/ Digital Pathology: PP, LML, MR for search becoming terabyte 3D images, Global Classification • 18&35: Computational Bioimaging (Light Sources): PP, LML Also materials • 26: Large-scale Deep Learning: GMLStanford ran 10 million images and 11 billion parameters on a 64 GPU HPC; vision (drive car), speech, and Natural Language Processing • 27: Organizing large-scale, unstructured collections of photos: GMLFit position and camera direction to assemble 3D photo ensemble • 36: Catalina Real-Time Transient Synoptic Sky Survey (CRTS): PP, LMLfollowed by classification of events (GML) • 43: Radar Data Analysis for CReSIS Remote Sensing of Ice Sheets: PP, LML to identify glacier beds; GML for full ice-sheet • 44: UAVSAR Data Processing, Data Product Delivery, and Data Services: PP to find slippage from radar images • 45, 46: Analysis of Simulation visualizations: PP LML ?GML find paths, classify orbits, classify patterns that signal earthquakes, instabilities, climate, turbulence
13: Cloud Large Scale Geospatial Analysis and Visualization • Application: Need to support large scale geospatial data analysisand visualization with number of geospatially aware sensors and the number of geospatially tagged data sources rapidly increasing. • Current Approach: Traditional GIS systems are generally capable of analyzing millions of objects and easily visualizing thousands. Data types include Imagery (various formats such as NITF, GeoTiff, CADRG), and vector with various formats like shape files, KML, text streams. Object types include points, lines, areas, polylines, circles, ellipses. Data accuracy very important with image registration and sensor accuracy relevant. Analytics include closest point of approach, deviation from route, and point density over time, PCA and ICA. Software includes Server with Geospatially enabled RDBMS, Geospatial server/analysis software – ESRI ArcServer, Geoserver; Visualization by ArcMap or browser based visualization • Futures:Today’s intelligence systems often contain trillions of geospatial objects and need to be able to visualize and interact with millions of objects. Critical issues are Indexing, retrieval and distributed analysis; Visualization generation and transmission; Visualization of data at the end of low bandwidth wireless connections; Data is sensitive and must be completely secure in transit and at rest (particularly on handhelds); Geospatial data requires unique approaches to indexing and distributed analysis. Defense PP, GIS, Classification Streaming Parallelism over Sensors and people accessing data
13: Cloud Large Scale Geospatial Analysis and Visualization Defense • This introduces important concept of a Geographical Information System displaying results from sensors • GIS: Geotagged data and often displayed in ESRI, Google Earth etc. PP, GIS, Classification Streaming Parallelism over Sensors and people accessing data
14: Object identification and tracking from Wide Area Large Format Imagery (WALF) Imagery or Full Motion Video (FMV) – Persistent Surveillance Defense • Application: Persistent surveillance sensors can easily collect petabytes of imagery data in the space of a few hours. The data should be reduced to a set of geospatial object (points, tracks, etc.) which can easily be integrated with other data to form a common operational picture. Typical processing involves extracting and tracking entities (vehicles, people, packages) over time from the raw image data. • Current Approach:The data needs to be processed close to the sensor which is likely forward deployed since data is too large to be easily transmitted. Typical object extraction systems are currently small (1-20 node) GPU enhanced clusters. There are a wide range of custom software and tools including traditional RDBMS’s and display tools. Real time data obtained at FMV (Full Motion Video) – 30-60 frames per/sec at full color 1080P resolution or WALF (Wide Area Large Format) with 1-10 frames per/sec at 10Kx10K full color resolution. Visualization of extracted outputs will typically be as overlays on a geospatial (GIS) display. Analytics are basic object detection analytics and integration with sophisticated situation awareness tools with data fusion. Significant security issues to ensure the enemy is not able to know what we see. • Futures:Typical problem is integration of this processing into a large (GPU) cluster capable of processing data from several sensors in parallel and in near real time. Transmission of data from sensor to system is also a major challenge. Streaming PP, GIS, MR, MRIter? Classification Parallelism over Sensors and people accessing data
15: Intelligence Data Processing and Analysis Defense • Application: Allow Intelligence Analysts to a) Identify relationshipsbetween entities (people, organizations, places, equipment) b) Spot trends in sentiment or intent for either general population or leadership group (state, non-state actors) c) Find location of and possibly timing of hostile actions (including implantation of IEDs) d) Track the location and actions of (potentially) hostile actors e) Ability to reason against and derive knowledge from diverse, disconnected, and frequently unstructured (e.g. text) data sources f) Ability to process data close to the point of collection and allow data to be shared easily to/from individual soldiers, forward deployed units, and senior leadership in garrison. • Current Approach: Software includes Hadoop, Accumulo (Big Table), Solr, Natural Language Processing, Puppet (for deployment and security) and Storm running on medium size clusters. Data size in 10s of Terabytes to 100s of Petabytes with Imagery intelligence device gathering petabyte in a few hours. Dismounted warfighters would have at most 1-100s of Gigabytes (typically handheld data storage). • Futures: Data currently exists in disparate silos which must be accessible through a semantically integrated data space. Wide variety of data types, sources, structures, and quality which will span domains and requires integrated search and reasoning. Most critical data is either unstructured or imagery/video which requires significant processing to extract entities and information. Network quality, Provenance and security essential. Streaming GIS, MR, MRIter?, Classification, Fusion Parallelism over Sensors and people accessing data
Healthcare Life Sciences 17:Pathology Imaging/ Digital Pathology I • Application: Digital pathology imaging is an emerging field where examination of high resolution images of tissue specimens enables novel and more effective ways for disease diagnosis. Pathology image analysis segments massive (millions per image) spatial objects such as nuclei and blood vessels, represented with their boundaries, along with many extracted image features from these objects. The derived information is used for many complex queries and analytics to support biomedical research and clinical diagnosis. Streaming Parallelism over Images MR, MRIter, PP, Classification
Healthcare Life Sciences 17:Pathology Imaging/ Digital Pathology II • Current Approach: 1GB raw image data + 1.5GB analytical results per 2D image. MPI for image analysis; MapReduce + Hive with spatial extension on supercomputers and clouds. GPU’s used effectively. Figure below shows the architecture of Hadoop-GIS, a spatial data warehousing system over MapReduce to support spatial analytics for analytical pathology imaging. • Futures: Recently, 3D pathology imaging is made possible through 3D laser technologies or serially sectioning hundreds of tissue sections onto slides and scanning them into digital images. Segmenting 3D microanatomic objects from registered serial images could produce tens of millions of 3D objects from a single image. This provides a deep “map” of human tissues for next generation diagnosis. 1TB raw image data + 1TB analytical results per 3D image and 1PB data per moderated hospital per year. Architecture of Hadoop-GIS, a spatial data warehousing system over MapReduce to support spatial analytics for analytical pathology imaging
26: Large-scale Deep Learning • Application: Large models (e.g., neural networks with more neurons and connections) combined with large datasets are increasingly the top performers in benchmark tasks for vision, speech, and Natural Language Processing. One needs to train a deep neural network from a large (>>1TB) corpus of data (typically imagery, video, audio, or text). Such training procedures often require customization of the neural network architecture, learning criteria, and dataset pre-processing. In addition to the computational expense demanded by the learning algorithms, the need for rapid prototyping and ease of development is extremely high. • Current Approach: Thelargest applications so far are to image recognition and scientific studies of unsupervised learning with 10 million images and up to 11 billion parameters on a 64 GPU HPC Infiniband cluster. Both supervised (using existing classified images) and unsupervised applications • Futures: Large datasets of 100TB or more may be necessary in order to exploit the representational power of the larger models. Training a self-driving car could take 100 million images at megapixel resolution. Deep Learning shares many characteristics with the broader field of machine learning. The paramount requirements are high computational throughput for mostly dense linear algebra operations, and extremely high productivity for researcher exploration. One needs integration of high performance libraries with high level (python) prototyping environments Classified OUT IN Deep Learning, Social Networking GML, EGO, MRIter, Classify
27: Organizing large-scale, unstructured collections of consumer photos I • Application: Produce 3D reconstructions of scenes using collections of millions to billions of consumer images, where neither the scene structure nor the camera positions are known a priori. Use resulting 3d models to allow efficient browsing of large-scale photo collections by geographic position. Geolocate new images by matching to 3d models. Perform object recognition on each image. 3d reconstruction posed as a robust non-linear least squares optimization problem where observed relations between images are constraints and unknowns are 6-d camera pose of each image and 3-d position of each point in the scene. • Current Approach: Hadoop cluster with 480 cores processing data of initial applications. Note over 500 billion images on Facebook and over 5 billion on Flickr with over 500 million images added to social media sites each day. Deep Learning Social Networking EGO, GIS, MR, Classification Parallelism over Photos
Deep Learning Social Networking 27: Organizing large-scale, unstructured collections of consumer photos II • Futures:Need many analytics including feature extraction, feature matching, and large-scale probabilistic inference, which appear in many or most computer vision and image processing problems, including recognition, stereo resolution, and image denoising. Need to visualize large-scale 3-d reconstructions, and navigate large-scale collections of images that have been aligned to maps.
Astronomy & Physics 36: Catalina Real-Time Transient Survey (CRTS): a digital, panoramic, synoptic sky survey I • Application: The survey explores the variable universe in the visible light regime, on time scales ranging from minutes to years, by searching for variable and transient sources. It discovers a broad variety of astrophysical objects and phenomena, including various types of cosmic explosions (e.g., Supernovae), variable stars, phenomena associated with accretion to massive black holes (active galactic nuclei) and their relativistic jets, high proper motion stars, etc. The data are collected from 3 telescopes (2 in Arizona and 1 in Australia), with additional ones expected in the near future (in Chile). • Current Approach: The survey generates up to ~ 0.1 TB on a clear night with a total of ~100 TB in current data holdings. The data are preprocessed at the telescope, and transferred to Univ. of Arizona and Caltech, for further analysis, distribution, and archiving. The data are processed in real time, and detected transient events are published electronically through a variety of dissemination mechanisms, with no proprietary withholding period (CRTS has a completely open data policy). Further data analysis includes classification of the detected transient events, additional observations using other telescopes, scientific interpretation, and publishing. In this process, it makes a heavy use of the archival data (several PB’s) from a wide variety of geographically distributed resources connected through the Virtual Observatory (VO) framework. PP, ML, Classification Streaming Parallelism over Images and Events: Celestial events identified in Telescope Images
Astronomy & Physics 36: Catalina Real-Time Transient Survey (CRTS): a digital, panoramic, synoptic sky survey II • Futures: CRTS is a scientific and methodological testbedand precursor of larger surveys to come, notably the Large Synoptic Survey Telescope (LSST), expected to operate in 2020’s and selected as the highest-priority ground-based instrument in the 2010 Astronomy and Astrophysics Decadal Survey. LSST will gather about 30 TB per night.
35: Light source beamlines • Application: Samples are exposed to X-rays from light sources in a variety of configurations depending on the experiment. Detectors (essentially high-speed digital cameras) collect the data. The data are then analyzed to reconstruct a view of the sample or process being studied. • Current Approach: A variety of commercial and open source software is used for data analysis – examples including Octopus for Tomographic Reconstruction, Avizo (http://vsg3d.com) and FIJI (a distribution of ImageJ) for Visualization and Analysis. Data transfer is accomplished using physical transport of portable media (severely limits performance) or using high-performance GridFTP, managed by Globus Online or workflow systems such as SPADE. • Futures:Camera resolution is continually increasing. Data transfer to large-scale computing facilities is becoming necessary because of the computational power required to conduct the analysis on time scales useful to the experiment. Large number of beamlines (e.g. 39 at LBNL ALS) means that total data load is likely to increase significantly and require a generalized infrastructure for analyzing gigabytes per second of data from many beamline detectors at multiple facilities. Research Ecosystem PP, LML, Streaming
43: Radar Data Analysis for CReSIS Remote Sensing of Ice Sheets I • Application: This data feeds into intergovernmental Panel on Climate Change (IPCC) and uses custom radars to measures ice sheet bed depths and (annual) snow layers at the North and South poles and mountainous regions. • Current Approach: The initial analysis is currently Matlab signal processing that produces a set of radar images. These cannot be transported from field over Internet and are typically copied to removable few TB disks in the field and flown “home” for detailed analysis. Image understanding tools with some human oversight find the image features (layers) shown later, that are stored in a database front-ended by a Geographical Information System. The ice sheet bed depths are used in simulations of glacier flow. The data is taken in “field trips” that each currently gather 50-100 TB of data over a few week period. • Futures:An order of magnitude more data (petabyte per mission) is projected with improved instrumentation. Demands of processing increasing field data in an environment with more data but still constrained power budget, suggests low power/performance architectures such as GPU systems. Earth, Environmental and Polar Science Streaming PP, GIS Parallelism over Radar Images
43: Radar Data Analysis for CReSIS Remote Sensing of Ice Sheets II • Typical CReSIS data showing aircraft taking data which shows a glacier bed at a depth of 3100 meters with multiple confusing reflections. Earth, Environmental and Polar Science
43: Radar Data Analysis for CReSIS Remote Sensing of Ice Sheets III • Typical flight paths of CReSIS data gathering in survey region Earth, Environmental and Polar Science
Earth, Environmental and Polar Science 43: Radar Data Analysis for CReSIS Remote Sensing of Ice Sheets IV • Typical CReSIS echogram with Detected Boundaries. The upper (green) boundary is between air and ice layer while the lower (red) boundary is between ice and terrain Streaming Parallelism over Radar Images PP, GIS
44: UAVSAR Data Processing, Data Product Delivery, and Data Services I • Application: Synthetic Aperture Radar (SAR) can identify landscape changes caused by seismic activity, landslides, deforestation, vegetation changes and flooding. This is for example used to support earthquake science (see next slide) as well as disaster management. This use case supports the storage, application of image processing and visualization of this geo-located data with angular specification. • Current Approach: Data from planes and satellites is processed on NASA computers before being stored after substantial data communication. The data is made public as soon as processed and requires significant curation due to instrumental glitches. The current data size is ~150TB • Futures: The data size would increase dramatically if Earth Radar Mission launched. Clouds are suitable hosts but are not used today in production. Earth, Environmental and Polar Science Parallelism over Radar Images Streaming PP, GIS
44: UAVSAR Data Processing, Data Product Delivery, and Data Services II Earth, Environmental and Polar Science Combined unwrapped coseismic interferograms for flight lines 26501, 26505, and 08508 for the October 2009 – April 2010 time period. End points where slip can be seen on the Imperial, Superstition Hills, and Elmore Ranch faults are noted. GPS stations are marked by dots and are labeled. PP, GIS Parallelism over Radar Images Streaming
Internet of Things and Streaming Apps • It is projected that there will be 24 (Mobile IndustryGroup) to 50 (Cisco) billion deviceson the Internet by 2020. • Thecloud natural controller of and resource providerfor the Internet of Things. • Smart phones/watches, Wearable devices (Smart People), “Intelligent River” “Smart Homes and Grid” and “Ubiquitous Cities”, Robotics. • Majority of use cases are streaming – experimental science gathers data in a stream – sometimes batched as in a field trip. Below is sample • 10: Cargo Shipping Tracking as in UPS, FedexPP GIS LML • 13: Large Scale Geospatial Analysis and Visualization PP GIS LML (in image set) • 28: Truthy: Information diffusion research from Twitter Data PP MR for Search, GML for community determination • 39: Particle Physics: Analysis of LHC Large Hadron Collider Data: Discovery of Higgs particle PP Local Processing Global statistics • 50: DOE-BER AmeriFlux and FLUXNET Networks PP GIS LML • 51: Consumption forecasting in Smart Grids PP GIS LML
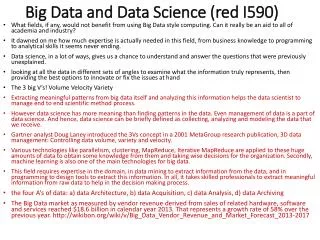
SS Database SS SS SS SS SS DiscoveryCloud DiscoveryCloud FilterCloud FilterCloud FilterCloud FilterCloud FilterCloud FilterCloud FilterCloud FilterCloud FilterCloud FilterCloud ComputeCloud StorageCloud SS SS SS SS SS SS Raw Data Data Information Knowledge Wisdom Decisions AnotherGrid SS SS SS SS SS Portal Fusion for Discovery/Decisions AnotherService SS: Sensor or Data Interchange Service Workflow through multiple filter/discovery clouds AnotherCloud SS SS SS SS SS SS SS SS DistributedGrid Hadoop Cluster
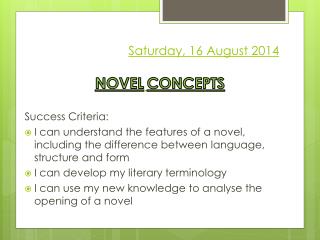
IOTCloud • Device Pub-SubStorm Datastore Data Analysis • Apache Storm provides scalable distributed system for processing data streams coming from devices in real time. • For example Storm layer can decide to store the data in cloud storage for further analysis or to send control data back to the devices • Evaluating Pub-Sub Systems ActiveMQ, RabbitMQ, Kafka, Kestrel Turtlebot and Kinect
Storm PerformanceFrom Device to Cloud • 6 FutureGrid India Medium OpenStack machines • 1 Broker machine, RabbitMQ 1 machine hosting ZooKeeper and Storm – Nimbus (Master for Storm) • 2 Sensor sites generating data • 2 Storm nodes sending back the same data and we measure the unidirectional latency • Using drones and Kinects System saturates
Commercial 10: Cargo Shipping Architecture Industry Standards Continuous Tracking PP Streaming
Earth, Environmental and Polar Science 50: DOE-BER AmeriFlux and FLUXNET Networks • Application:AmeriFlux and FLUXNET are US and world collections respectively of sensors that observe trace gas fluxes (CO2, water vapor) across a broad spectrum of times (hours, days, seasons, years, and decades) and space. Moreover, such datasets provide the crucial linkages among organisms, ecosystems, and process-scale studies—at climate-relevant scales of landscapes, regions, and continents—for incorporation into biogeochemical and climate models. • Current Approach:Software includes EddyPro, Custom analysis software, R, python, neural networks, Matlab. There are ~150 towers in AmeriFlux and over 500 towers distributed globally collecting flux measurements. • Futures:Field experiment data taking would be improved by access to existing data and automated entry of new data via mobile devices. Need to support interdisciplinary study integrating diverse data sources. Fusion, PP, GIS Streaming Parallelism over Sensors
Energy 51: Consumption forecasting in Smart Grids • Application: Predict energy consumption for customers, transformers, sub-stations and the electrical grid service area using smart meters providing measurements every 15-mins at the granularity of individual consumers within the service area of smart power utilities. Combine Head-end of smart meters (distributed), Utility databases (Customer Information, Network topology; centralized), US Census data (distributed), NOAA weather data (distributed), Micro-grid building information system (centralized), Micro-grid sensor network (distributed). This generalizes to real-time data-driven analytics for time series from cyber physical systems • Current Approach: GIS based visualization. Data is around 4 TB a year for a city with 1.4M sensors in Los Angeles. Uses R/Matlab, Weka, Hadoop software. Significant privacy issues requiring anonymization by aggregation. Combine real time and historic data with machine learning for predicting consumption. • Futures: Wide spread deployment of Smart Grids with new analytics integrating diverse data and supporting curtailment requests. Mobile applications for client interactions. Streaming Parallelism over Sensors Fusion, PP, MR, ML, GIS, Classification
Deep Learning Social Networking 28: Truthy: Information diffusion research using Twitter Data • Application: Understanding how communication spreads on socio-technical networks. Detecting potentially harmful information spread at the early stage (e.g., deceiving messages, orchestrated campaigns, untrustworthy information, etc.) • Current Approach: 1) Acquisition and storage of a large volume (30 TB a year compressed) of continuous streaming data from Twitter (~100 million messages per day, ~500GB data/day increasing over time); (2) near real-time analysis of such data, for anomaly detection, stream clustering, signal classification and online-learning; (3) data retrieval, big data visualization, data-interactive Web interfaces, public API for data querying. Use Python/SciPy/NumPy/MPI for data analysis. Information diffusion, clustering, and dynamic network visualization capabilities already exist • Futures:Truthy plans to expand incorporating Google+ and Facebook. Need to move towards Hadoop/IndexedHBase & HDFS distributed storage. Previously used Redis as an in-memory database to be a buffer for real-time analysis. Need streaming clustering, anomaly detection and online learning. Index, S/Q, MR, MRIter, Graph, Classification Streaming Parallelism over Tweets
39: Particle Physics: Analysis of LHC Large Hadron Collider Data: Discovery of Higgs particle I • Application: One analyses collisions at the CERN LHC (Large Hadron Collider) Accelerator and Monte Carlo producing events describing particle-apparatus interaction. Processed information defines physics properties of events (lists of particles with type and momenta). These events are analyzed to find new effects; both new particles (Higgs) and present evidence that conjectured particles (Supersymmetry) have not been detected. LHC has a few major experiments including ATLAS and CMS. These experiments have global participants (for example CMS has 3600 participants from 183 institutions in 38 countries), and so the data at all levels is transported and accessed across continents. CERN LHC Accelerator Ring (27 km circumference. Up to 175m depth) at Geneva with 4 Experiment positions marked MRStat or PP, MC Parallelism over observed collisions Astronomy & Physics
39: Particle Physics: Analysis of LHC Large Hadron Collider Data: Discovery of Higgs particle II • Current Approach: The LHC experiments are pioneers of a distributed Big Data science infrastructure, and several aspects of the LHC experiments’ workflow highlight issues that other disciplines will need to solve. These include automation of data distribution, high performance data transfer, and large-scale high-throughput computing. Grid analysis with 350,000 cores running “continuously” over 2 million jobs per day arranged in 3 tiers (CERN, “Continents/Countries”. “Universities”). Uses “Distributed High Throughput Computing” (Pleasing parallel) architecture with facilities integrated across the world by WLCG (LHC Computing Grid) and Open Science Grid in the US. • 15 Petabytes data gathered each year from Accelerator data and Analysis with 200PB total. Specifically in 2012 ATLAS had at Brookhaven National Laboratory (BNL) 8PB Tier1 tape; BNL over 10PB Tier1 disk and US Tier2 centers 12PB disk cache. CMS has similar data sizes. Note over half resources used for Monte Carlo simulations as opposed to data analysis
Distributed Computing Practice for Large-Scale Science & Engineering S. Jha, M. Cole, D. Katz, O. Rana, M. Parashar, and J. Weissman, • Work of
10 Security & Privacy Use Cases • Consumer Digital Media Usage • Nielsen Homescan • Web Traffic Analytics • Health Information Exchange • Personal Genetic Privacy • PharmaClinic Trial Data Sharing • Cyber-security • Aviation Industry • Military - Unmanned Vehicle sensor data • Education - “Common Core” Student Performance Reporting
7 Computational Giants of NRC Massive Data Analysis Report • G1: Basic Statistics e.g. MRStat • G2: Generalized N-Body Problems • G3: Graph-Theoretic Computations • G4: Linear Algebraic Computations • G5: Optimizations e.g. Linear Programming • G6: Integration e.g. LDA and other GML • G7: Alignment Problems e.g. BLAST http://www.nap.edu/catalog.php?record_id=18374
Would like to capture “essence of these use cases” “small” kernels, mini-apps Or Classify applications into patterns Do it from HPC background not database viewpoint e.g. focus on cases with detailed analytics Section 5 of my class https://bigdatacoursespring2014.appspot.com/previewclassifies 51 use cases with ogre facets
HPC Benchmark Classics • Linpackor HPL: Parallel LU factorization for solution of linear equations • NPB version 1: Mainly classic HPC solver kernels • MG: Multigrid • CG: Conjugate Gradient • FT: Fast Fourier Transform • IS: Integer sort • EP: Embarrassingly Parallel • BT: Block Tridiagonal • SP: Scalar Pentadiagonal • LU: Lower-Upper symmetric Gauss Seidel
13 Berkeley Dwarfs • Dense Linear Algebra • Sparse Linear Algebra • Spectral Methods • N-Body Methods • Structured Grids • Unstructured Grids • MapReduce • Combinational Logic • Graph Traversal • Dynamic Programming • Backtrack and Branch-and-Bound • Graphical Models • Finite State Machines First 6 of these correspond to Colella’s original. Monte Carlo dropped. N-body methods are a subset of Particle in Colella. Note a little inconsistent in that MapReduce is a programming model and spectral method is a numerical method. Need multiple facets!
Facets of the OgresMeta or Macro Aspects:Problem Architecture and Computational Features
Problem Architecture Facet of Ogres (Meta or MacroPattern) • Pleasingly Parallel – as in BLAST, Protein docking, some (bio-)imagery including Local Analytics or Machine Learning – ML or filtering pleasingly parallel, as in bio-imagery, radar images (pleasingly parallel but sophisticated local analytics) • Classic MapReduce: Search, Index and Query and Classification algorithms like collaborative filtering (G1 for MRStat in Features, G7) • Global Analytics or Machine Learning requiring iterative programming models (G5,G6). Often from • Maximum Likelihood or 2minimizations • Expectation Maximization (often Steepest descent) • Problem set up as a graph (G3) as opposed to vector, grid • SPMD: Single Program Multiple Data • BSP or Bulk Synchronous Processing: well-defined compute-communication phases • Fusion: Knowledge discovery often involves fusion of multiple methods. • Workflow: All applications often involve orchestration (workflow) of multiple components • Use Agents: as in epidemiology (swarm approaches) Note problem and machine architectures are related
One Facet of Ogres has Computational Features • Flops per byte; • Communication Interconnect requirements; • Is application (graph) constant or dynamic? • Most applications consist of a set of interconnected entities; is this regular as a set of pixels or is it a complicated irregular graph? • Is communication BSP, Asynchronous, Pub-Sub, Collective, Point to Point? • Are algorithms Iterative or not? • Are algorithms governed by dataflow • Data Abstraction: key-value, pixel, graph, vector • Are data points in metric or non-metric spaces? • Is algorithm O(N2) or O(N) (up to logs) for N points per iteration (G2) • Core libraries needed: matrix-matrix/vector algebra, conjugate gradient, reduction, broadcast