Download
1 / 12
130 likes | 331 Views
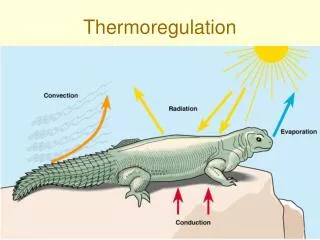
How does temperature effect ectotherms ?. Background Information. Ectotherms (many are more specifically poikilotherms ) utilize heat from their surroundings to increase their body temperature and metabolism.

E N D
Background Information • Ectotherms (many are more specifically poikilotherms) utilize heat from their surroundings to increase their body temperature and metabolism. • Once body temperature increases metabolism increases and energy needed by the organism is created. • Ectotherm examples: fish, amphibians, insects, reptiles
Background Information Oxidative Respiration Glucose + Oxygen -> Carbon Dioxide +Water+ ATP
Protocol • Weigh one adult cockroach, place in respiration chamber and attach the CO2 and O2 sensors. • Measure CO2 and O2 at room temperature over 3 minute period. Record 3 readings. • Move respiration chamber to either a warm or cold water bath. • Wait 10 minutes then record the temperature and CO2 and O2 readings. (See page 172) • Make multiple readings over a 30 minute period, every 3-5 minutes.
Lab Report • Title • Abstract • Introduction • Materials and Methods • Results • Discussion • Literature Cited • Tables and Figures
Lab Report • Title: Short, but descriptive, one sentence long • Abstract: Reason for performing the experiment, briefly mention methods and results, list implications of results • Introduction: Introduce hypothesis and background information, mention any relevant papers • Materials and Methods: Explain how the hypothesis was tested, detailed account of materials were used to accomplish set goals, NO lists, write in past tense
Lab Report • Results: Findings of the experiments, don’t discuss implications or opinions in this section, reference tables and figures • Discussion: Implications of results, reference tables and figures, future directions for testing • Literature Cited: Must be in CSE format and organized alphabetically • Tables and Figures: Descriptive title with each axis, column, or row properly labeled, list appropriate units
Lab Report • The title should be centered and bolded. • The author’s full name should follow the title on a separate line. • Section headings should also be centered, bolded and on a separate line. • Sub-headings should be left justified, and on its own line. • The abstract should not have a heading. • The entire document should be double-spaced. • All text should be 12pt Times New Roman. • All margins should be set to 1”
Lab Report • Citations: Should be made within the text listing the author’s last name and year of publication Example: Inactivation of a single copy of Tbx1 results in the etiology of the deletion disorder in humans with or without the presence of the chromosome deletion (Johnston, 2005). CSE Format: • Johnston, PC. 2008.“DiGeorge syndrome presenting as late onset hypocalcaemia in adulthood.” Ulster Med J.77(3): 201–202.
Statistical Analysis • Construct a table with minutes elapsed, temperature (°C), CO2 and O2 levels (%). • Calculate mean CO2 and O2 level for each temperature as well as standard deviation. • Calculate average change in O2 (%) per degree Celsius of change in temperature [=total change in O2 level/total change in temperature], perform for CO2
Statistical Analysis • Construct a line graph of temperature (°C) vs O2 levels (%), perform for CO2 • Extra: Perform a student t-test to determine if differences between the ‘cold’ readings and ‘hot’ readings are statistically significant.