Download
1 / 81
810 likes | 930 Views
Jeffrey A. Bridge, Ph.D. PI, Center for Innovation in Pediatric Practice Associate Professor of Pediatrics The Ohio State University. Suicide Trends, Service Gaps, and the Public Health. Disclosures.

E N D
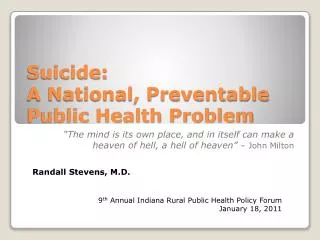
Jeffrey A. Bridge, Ph.D. PI, Center for Innovation in Pediatric Practice Associate Professor of Pediatrics The Ohio State University Suicide Trends, ServiceGaps, and the Public Health
Disclosures • I currently receive grant funding from the National Institute of Mental Health, Centers for Disease Control and Prevention, and the American Foundation for Suicide Prevention • I have no financial relationships or Conflicts of Interest (COIs) to disclose
Objectives • Discuss and compare suicide trends in Ohio and the United States • Aspirational goals of the National Action Alliance for Suicide Prevention (Action Alliance) • Opportunities to reduce suicide rates in Ohio and the US: Focus on access to health services and periods of high risk
The Burden of Suicide in the U.S. • In 2010, suicide was the 10th leading cause of death, claiming more than 38,000 lives • Every year, suicide claims more than twice as many lives as homicide • More than 8.5 million U.S. adults report having serious thoughts of suicide and 1.1 million people report making a suicide attempt in the past 12 months • The burden of suicide extends beyond those who have considered or attempted suicide, or have taken their own lives. Source: CDC WISQARS, 2014, www.cdc.gov/injury/wisqars/index.html; SAMHSA, 2010; www.suicide-research-agenda.org
The Problem of Youth Suicide* • In 2010, suicide was the 10th leading cause of death for all ages but the 3rd leading cause of death for youth aged 10-19 years in the United States • There were 1,926 suicide deaths among U.S. children and adolescents in 2010 More deaths from suicide than deaths from 7 other leading causes combined 24 68 79 82 129 459 1,078 1,926 *CDC WISQARS, 2014, www.cdc.gov/injury/wisqars/index.html
The Burden of Suicide in Ohio • In 2010, suicide was the 11th leading cause of death for all ages and the 2ndleading cause of death in youth aged 10-19 years • In 2010, more than twice as many Ohioans died by suicide than by homicide (1,439 suicide deaths vs. 569 homicide deaths) • Ohio’s average annual medical cost for suicide per year is $3,924,000 and work loss costs for suicide per year are $1.4 billion dollars Source: CDC WISQARS, 2014; www.cdc.gov/injury/wisqars/index.html. Cost of Injury Reports; Pacific Institute for Research and Evaluation (PIRE), Calverton, MD for unit cost estimates.
Columbus Dispatch: ‘Youth Suicides Up in Franklin County’, December 16, 2012 • Dramatic single-year increase in the number of pediatric suicides in Franklin County • The number of suicide deaths in 2012 is equal to the number of suicide deaths in the past 5 years combined
Comparison of Suicide Rates in Ohio and the United States, 2001-2010 The suicide rate among Ohioans increased 15.1%, from 10.6 per 100,000 persons in 2001 to 12.2 per 100,000 in 2010 Source: Centers for Disease Control and Prevention; WISQARS; www.cdc.gov/injury/wisqars/index.html
Comparison of Suicide Rates in Ohio and U.S. by Sex, 2010 Suicide among males is roughly four times higher than among females and represents 79% of all U.S. suicide deaths Source: Centers for Disease Control and Prevention, WISQARS; data accessed from http://webappa.cdc.gov/sasweb/ncipc/dataRestriction_inj.html
Comparison of Suicide Rates in Males and Females by Age, 2010 Source: Centers for Disease Control and Prevention, WISQARS; data accessed from http://webappa.cdc.gov/sasweb/ncipc/dataRestriction_inj.html
Suicide Rates by Age and Sex in US Youths, 2006-2010* *CDC WISQARS, 2014, www.cdc.gov/injury/wisqars/index.html
Suicide Rates by Race / Ethnicity, US and Ohio, 2010 *Other race includes American Indian/AlaskanNative and Pacific Islander, Non-Hispanic; Source: CDC WISQARS, 2014, www.cdc.gov/injury/wisqars/index.html
Suicide Deaths by Mechanism, Ohio, 2006 to 2010 5.9% 7.0% 5.2% 19.3% 37.4% 50.2% 51.5% 23.5% Source: Centers for Disease Control and Prevention, National Center for Health Statistics. Compressed Mortality File 1999-2010 on CDC WONDER Online Database. Accessed at http://wonder.cdc.gov/cmf-icd10.html
Suicide Rates per 100,000 Population, Ohio Counties, All Ages, 2004-2010* *Annualized age-adjusted suicide rate for Ohio: 11.37 Source: CDC WISQARS, 2014, http://wisqars.cdc.gov:8080/cdcMapFramework/
Suicide Rates per 100,000 Population, Ohio Counties, All Ages, 2004-2010* Monroe County Age-adjusted suicide rate: 21.60 *Annualized age-adjusted suicide rate for Ohio: 11.37 Source: CDC WISQARS, 2014, http://wisqars.cdc.gov:8080/cdcMapFramework/
Suicide Rates per 100,000 Population, Ohio Counties, All Ages, 2004-2010* Monroe County Population: 14,642 Population density: 32.0 sq mile *Annualized age-adjusted suicide rate for Ohio: 11.37 Source: CDC WISQARS, 2014, http://wisqars.cdc.gov:8080/cdcMapFramework/
National Action Alliance for Suicide Prevention (i.e. Action Alliance) Source: http://actionallianceforsuicideprevention.org/about-us
About the Action Alliance • It is the public-private partnership advancing the National Strategy for Suicide Prevention • Mission: • Championing suicide prevention as a national priority • Catalyzing efforts to implement high priority objectives of the NSSP • Cultivating the resources needed to sustain progress • Goal: • To save 20,000 lives in five years Source: http://actionallianceforsuicideprevention.org/about-us
2014 National Action Alliance for Suicide Prevention (Action Alliance) • Suicide rates in the U.S. have remain relatively unchanged during the past 70 years despite unprecedented advancement in the diagnosis and treatment of mental illness • Build a research agenda that, if fully implemented, will reduce suicide deaths and suicide attempts by 20% within five years • This goal translates into a reduction of ~7,000 suicide deaths and 130,000 – 220,000 suicide attempts each year by 2018 • For children and adolescents: a reduction of nearly 400 suicide deaths and 7,100 – 12,100 attempts each year by 2018 Source: Pringle et al., PsychiatrServ, 64:71-5, 2013; Action Alliance Research Prioritization Report, 2014
Increasing Suicide Rates in the U.S., 2000-2010* 38,364 deaths 29,350 deaths Source: CDC, WISQARS, 2014, www.cdc.gov/injury/wisqars/index.html
Increasing Suicide Rates in the U.S., 2000-2010* 38,364 deaths 29,350 deaths Source: CDC, WISQARS, 2014, www.cdc.gov/injury/wisqars/index.html
Increasing Suicide Rates in the U.S., 2000-2010* 38,364 deaths 23,018 deaths 29,350 deaths Source: CDC, WISQARS, 2014, www.cdc.gov/injury/wisqars/index.html
Aspirational Goals (AGs) for Research of the Action Alliance • AGs are defined as an important goal for scientists and researchers to achieve in order to reduce the number of people who attempt or die by suicide • 12 AGs were created as part of a Stakeholder Survey Source: Pringle et al., PsychiatrServ, 64:71-5, 2013; Action Alliance Research Prioritization Report, 2014
Aspirational Goals (AGs) for Research of the Action Alliance • AGs are defined as an important goal for scientists and researchers to achieve in order to reduce the number of people who attempt or die by suicide • 12 AGs were created as part of a Stakeholder Survey Source: Pringle et al., PsychiatrServ, 64:71-5, 2013; Action Alliance Research Prioritization Report, 2014
Aspirational Goals (AGs) for Research of the Action Alliance • AGs are defined as an important goal for scientists and researchers to achieve in order to reduce the number of people who attempt or die by suicide • 12 AGs were created as part of a Stakeholder Survey Source: Pringle et al., PsychiatrServ, 64:71-5, 2013; Action Alliance Research Prioritization Report, 2014
Aspirational Goals Aspirational Goal 8: Ensure that people at risk for suicidal behavior can access affordable care that works, no matter where they are. Aspirational Goal 9: Ensure that people getting care for suicidal thoughts and behaviors are followed through their treatment so they don’t fall through the cracks. Source: Action Alliance Research Prioritization Report, 2014
Access to Health Care and Suicide Rates • Ecological studies have shown suicide rates are inversely associated with indicators of access to health and mental health services • Increased staffing of mental health providers also has been found to be related to lower suicide rates within care systems (e.g., Veteran’s Administration) Source: Campo, J. CurrOpinPediatr21:628-634, 2009; Katz et al., PsychiatrServ, 64(7):620-5, 2013
Availability of Mental Health Service Providers and Suicide Rates in Austria Source: Kapusta et al., Psychiatric Services, 61:1198-1203, 2010
Availability of Mental Health Service Providers and Suicide Rates in Austria Source: Kapusta et al., Psychiatric Services, 61:1198-1203, 2010
Availability of Mental Health Service Providers and Suicide Rates in Austria Source: Kapusta et al., Psychiatric Services, 61:1198-1203, 2010
Associations Between Health Service Provision Practices and Suicide in Finland • After adjustment for local socioeconomic and demographic factors, lower suicide rates were associated with: • Greater local access to multifaceted outpatient mental health services (Panel A) • A predominance of outpatient services relative to inpatient services (Panel B) • Availability of 24-hour emergency psychiatric services (Panel C) A B C Pirkola et al., Lancet, 373(9658):147-53, 2009
Suicide Rates, Ohio Counties, 2004-2010: A Tale of Two Counties *Annualized age-adjusted suicide rate for Ohio: 11.37 Source: CDC WISQARS, 2014, http://wisqars.cdc.gov:8080/cdcMapFramework/
Suicide Rates, Ohio Counties, 2004-2010: A Tale of Two Counties Adams County Age-adjusted suicide rate: 19.40 (3rd) *Annualized age-adjusted suicide rate for Ohio: 11.37 Source: CDC WISQARS, 2014, http://wisqars.cdc.gov:8080/cdcMapFramework/
Suicide Rates, Ohio Counties, 2004-2010: A Tale of Two Counties Adams County Population: 28,550 Population density: 48.7 sq mile (7th) *Annualized age-adjusted suicide rate for Ohio: 11.37 Source: CDC WISQARS, 2014, http://wisqars.cdc.gov:8080/cdcMapFramework/
Suicide Rates, Ohio Counties, 2004-2010: A Tale of Two Counties Scioto County Age-adjusted suicide rate: 8.4 (3rd lowest) *Annualized age-adjusted suicide rate for Ohio: 11.37 Source: CDC WISQARS, 2014, http://wisqars.cdc.gov:8080/cdcMapFramework/
Suicide Rates, Ohio Counties, 2004-2010: A Tale of Two Counties Scioto County Population: 79,499 Population density: 129.0 sq mile (53rd) *Annualized age-adjusted suicide rate for Ohio: 11.37 Source: CDC WISQARS, 2014, http://wisqars.cdc.gov:8080/cdcMapFramework/
Mental Health Parity Laws and Suicide Rates in the U.S. • In mid-1990s, the first parity laws were enacted • Required insurance coverage to include mental health benefits at the same rates and terms as physical health benefits • State laws were enacted at different times and at varying levels of strength • Provides an opportunity to test whether increasing access to mental health care has a significant impact on suicide rates Source: Lang, M (2013). The impact of mental health insurance laws on state suicide rates. Health Economics, 22, 73-88; Action Alliance, 2014
Suicide Rate in the Year After Enactment of Mental Health Parity Laws (U.S.) 10.2 9.8 A 3.7% reduction in the suicide rate represents approximately 713 suicides prevented as a result of the parity laws in the year after enactment (1990 to 2010) Source: Lang, 2014: Action Alliance Prioritized Research Agenda, 2014
Mental Health Parity Laws: Additional Findings • Association between parity laws and suicide rates persisted in analyses that controlled for state-level unemployment rate, income per capita, and bankruptcy rate • Effect most prominent in the years immediately after enactment • When a state enacts a weak law, there is no significant impact on the suicide rate Source: Lang, 2014: Action Alliance Prioritized Research Agenda, 2014
Aspirational Goals Aspirational Goal 8: Ensure that people at risk for suicidal behavior can access affordable care that works, no matter where they are. Aspirational Goal 9: Ensure that people getting care for suicidal thoughts and behaviors are followed through their treatment so they don’t fall through the cracks. Source: Lang, 2014: Action Alliance Prioritized Research Agenda, 2014
Aspirational Goals Aspirational Goal 8: Ensure that people at risk for suicidal behavior can access affordable care that works, no matter where they are. Aspirational Goal 9: Ensure that people getting care for suicidal thoughts and behaviors are followed through their treatment so they don’t fall through the cracks. Source: Lang, 2014: Action Alliance Prioritized Research Agenda, 2014
Identifying 38,000 Suicide Decedents in the United States Firearm Deaths (51% of all suicides) 19,392 Motor Vehicle CO Poisoning Deaths ~735 Jail and Prison Inmates ~500 Active Duty Military ~300 Accessed Healthcare within 30 days of death ~17,100 Military Veterans ~8,360 Seen in ED for suicide attempt in past year ~7,800 Data source: Action Alliance Research Prioritization Report, page 80, 2014; data sources for estimates provided on page 81
Identifying 38,000 Suicide Decedents in the United States Firearm Deaths (51% of all suicides) 19,392 Motor Vehicle CO Poisoning Deaths ~735 Jail and Prison Inmates ~500 Active Duty Military ~300 Accessed Healthcare within 30 days of death ~17,100 Military Veterans ~8,360 Seen in ED for suicide attempt in past year ~7,800 Data source: Action Alliance Research Prioritization Report, page 80, 2014; data sources for estimates provided on page 81
Concentration of Suicide Risk: Period Immediately following Discharge from Psychiatric Hospital • Roughly 1 in 3 (39%) suicide deaths in the first year following hospital discharge occur in the first 28 days (Goldacre et al., 1993) Suicide Risk After Psychiatric Hospitalization* *Qin et al., Arch Gen Psychiatry, 62(4):427-32, 2005
Impact of Mental Health Service Recommendations on Suicide Rates: the U.K. Experience* • Examined changes in suicide rates as public mental health service settings began to implement suicide prevention recommendations: Examples: • 24-hour crisis teams • Removing ligature points • Conducting FU with patients within 7 days of discharge • Conducting assertive community outreach • Regular training to frontline staff *While et al., Lancet, 379(9820):1005-12, 2012
Before-and-After Study* 24.8 19.5 *P<.05 Adoption of a range of suicide prevention recommendations by mental health systems across England and Wales was found to significantly reduce suicide rates among patients (1997-2006) *While et al., Lancet, 379(9820):1005-12, 2012
Room for Improvement • Nationally, only about half of psychiatric inpatients receive any outpatient mental health care during the first week following hospital discharge • Only about two-thirds of psychiatric inpatients receive outpatient mental health care during the first month “A focus on improving linkage from inpatient to outpatient psychiatric care could lower suicide risk during this critical period” Source: National Committee on Quality Assurance, 2014; Olfsonet al.JAMA;311:1107-82014, 2014
Yet much remains unknown… • Which clinical interventions are most effective at protecting patients after psychiatric hospital discharge? • Case management/outreach vs. MI or individualized safety plans? • Patient connectedness and reducing social isolation “These lessons may help guide the search for successful care management approaches during the high-risk period immediately following psychiatric discharge” Source: Olfsonet al.JAMA;311:1107-82014, 2014