Download
1 / 29
290 likes | 424 Views
On the Role of Localized Relationships in Image Interpolation and CCD Demosaicing. RONEN SHER and MOSHE PORAT. Agenda. Image Interpolation Methods Image Regions B&W Method Algorithm Results Conclusions 1D Signal Method CCD Demosaicing Structure Components correlation

E N D
On the Role of Localized Relationships in Image Interpolation and CCD Demosaicing RONEN SHER and MOSHE PORAT
Agenda • Image Interpolation Methods • Image Regions • B&W Method • Algorithm • Results • Conclusions • 1D Signal Method • CCD Demosaicing • Structure • Components correlation • Statistical extention • Results
The Problem • Enlargement of an Image by 2x2 Input
Interpolations Methods • Bilinear • Bi-Cubic • Spline • Diffusion Equation
Interpolation Methods • Bilinear, in the case of enlargement by 2 In smooth eras it is a satisfying prediction
Pixels Correlation 1 • Normalized histograms of Lena gray Levels 256x256 -solid and 512x512-dashed
Image Sub-Regions • In edges regions an average prediction will result in a smoothness effect. • The edge must be preserved. • The edges exist in the input image and the same distribution is assumed in the large image.
Image Regions • In case of a horizontal edge: and • In case of a vertical edge: and • Depending on the four surrounding neighbors, there will be 4!=24 permutations
Image Regions • In each region a different waited sum is valid for the prediction • The coefficients • are learned from the input image
Coefficients calculation 1 • Scanning the Input Image for the x-kind pixels we determine its permutation from its four neighbors and saving it’s value and it’s neighbors value in VMx • modeling only the regions with significant changes in gray levels • The same rule holds for the +kind pixels
Coefficients calculation 2 • For each permutation we find the four coefficients using the Least Square solution • Same technique for the + coefficients
Algorithm B&W images • Scanning the Sparse Image • for each pixel we determine its matching permutation (coefficients) from its four neighbors and predict its value using
Algorithm B&W images • The Input is Ix For each “+” pixel we find its matching permutation (coefficients) and calculate its prediction by
Experiments - B&W images • The 24 vectors of coefficients of x-kind Lena with size 512x512- black disks and 256x256- empty circles
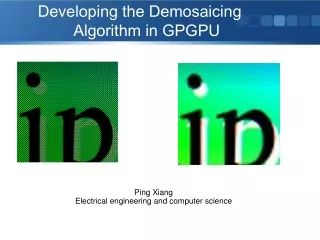
Experiments 1 - B&W images Original Bilinear Nearest neighbor (Input) proposed Bi-Cubic Bi-Cubic Spline
Experiments 2 - B&W images Original Bilinear Nearest neighbor (Input) Bi-Cubic Bi-Cubic Spline proposed
One Dimension Interpolation Interpolating yd, by using NR. Its adjacent samples serve as the four neighbors to find the coefficients.
1D Interpolation results 1 Sinc-MSE= 2.6651 NR-MSE= 0.8540 Signal is composed from sum of Sincs
1D Interpolation results 2 Voice signal: the word “Diskette”
Simple Method Treating each color component as individual B&W image
Components method • Using all colors neighbors for the green reconstruction • Reconstruct the difference of the colors components – Hues (R-G, B-G, R-B). Processing smoother signals.
Statistical extension • Separating each case to sub regions for better characterization. • Using the mean and the standard deviation of each neighbors’ set for the subtraction.
Results 1 Original Bi-Linear Gunturk Optimalrecovery Kimmel Neighbors Rule
Results 2 Original Bi-Linear Gunturk Optimalrecovery Kimmel Neighbors Rule
Summery • A new reconstruction method was presented for 1D signals, B&W images and CCD demosaicing using the correlation between low and high resolution versions. • The new method showed satisfying results compared to other known techniques.