Download
1 / 102
1.02k likes | 1.27k Views
World Oil. R&W pp. 46-57 Adelman, Ross, Krane , Downs. Link to syllabus. Link to WDI. World Production of Oil. U.S. Oil Production, Consumption, Imports. Source: U.S. DoE. Sources of U.S. Oil, 1973-99: (DOE). Oil Production and Exports, 2005. Source: US DoE. Petroleum.

E N D
World Oil R&W pp. 46-57 Adelman, Ross, Krane, Downs Link to syllabus Link to WDI
World Production of Oil U.S. Oil Production, Consumption, Imports Source: U.S. DoE
Oil Production and Exports, 2005 Source: US DoE
Petroleum Net Exporters Net Importers Increase Russia 3,077 Brazil 573 Saudi A. 717 Japan 473 Iraq 861 Algeria 458 Mexico 285 Qatar 271 Decrease Indonesia -707 USA -2,925 U.K. -676 China -2,592 Venezuela -466 India -707 Changes in Net Exports of Oil 1997-2004 (1,000 b/d) Source: Calculated using BP data.
Net Exporters Net Importers Increase Norway 740 Qatar 454 Trinidad 433 Canada 243 Decrease Mexico -221 S. Korea -323 Change in Net Exports of Natural Gas, 1997-2004 converted to oil equivalent, in thousand barrels/day Source: Calculated from BP Statistical Review, 2005
Shale oil and shale gas resources are globally abundant June 10, 2013
Proved oil reserves at end 2003 Source: BP. Data is obviously out of date.
Canadian Oil Sands And the Country with the Second Greatest Proved Oil Reserves Worldwide Is . . . Six months ago, “Iraq” was the correct completion of the above phrase. Its 112.5 billion barrels of proved oil reserves was second only to Saudi Arabia’s imposing 259.3 billion barrels. However, in the December 23, 2002, issue of the Oil & Gas Journal, proved oil reserves in Canada catapulted from an estimated 4.9 billion barrels in 2002 to an amazing 180 billion barrels in 2003. How was this possible? A methodology change by the Oil & Gas Journal now includes western Canada’s oil sands in its definition of proved oil reserves. Heretofore, oil sands were considered “nonconventional” and were not counted as proved oil reserves; however, dramatic reductions in development and production costs have brought oil sands into the realm of economic viability. With today’s technologies and oil prices, it is entirely appropriate to consider western Canada’s vast oil potential as being commensurate with “conventional” crude oils.a Source: US DoE http://www.eia.doe.gov/oiaf/ieo/oiltext_box.html
PRICES Real and nominal prices Lots of the U.S. price goes to taxes; about half goes to production Cost of production in MENA is quite low Dramatic differences in output/well
Fig. 3.3 p. 52 (R&W). Crude Oil Real Prices, 2004 US$ Iran-Iraq War Fall of Shah Iraq-Kuwait New Supplies, World Recession Embargo AsianCrisis
Nominal and Real Oil Prices, 1860-2010 Source: BP: Statistical Review of World Energy, 2011
Price of Gasoline/World Price 2000-08 Source: WDI. The world price averaged about US$ 0.90/liter
Costs of Production, (US$/barrel) 1960 “Unit costs of maintaining and expanding crude petroleum production in Middle East and other areas.” Middle East 0.15 United States 1.63 Venezuela 0.24 Canada 2.53 Far East 0.62 Posted prices in the Middle East were about $1.80; in US it was $3.28 Source: Issawi (1963) Economics of Middle Eastern Oil (p. 54) citing Chase Manhattan Bank
Exploration and Development Costs Source: OECD/IEA: WEIO Time period is early 2000s
Output/Well (barrels/day). 2003 Source: World Oil Sept 2004. Output and #wells in thousands.
OPEC Spare Production Capacity, 2011, 2003 Source: Energy Economist.com
Opec Capacity Utilization Rates Source: Shihad-Eldin (2004) Oil Output and Investment Prospects
U.S. Strategic Petroleum Reserve (in days) Source: U.S. D.o.E.
OPEC Members (formed 1960)
OPEC Secretary General Abdalla Salem El-Badri Libyan, born 1940. Bus Ad. Degree from Florida Southern U. First professional job was with Esso (Exxon/Mobil) c.v.
OPEC Countries: Crude Oil Saudi Arabia Iran Iraq
Saudi oil minister rules out output hike Friday, April 11, 2008 Compiled by Daily Star staff Saudi Oil Minister Ali Naimi said on Thursday that there were not enough buyers of oil to justify an increase in oil production, despite high prices, and he added that fossil fuels should supply the bulk of global energy needs for at least the next 50 years. Naimi also slammed biofuels, saying they did not protect the environment or help supply security, but added that solar power had to be considered one of the best clean-energy sources. Speaking outside an international oil conference in Paris as the price of oil hovers at near-record levels, he said there were not enough buyers of oil in the market to absorb extra output. Asking where the buyers were, he said that if more buyers emerged, then "we" would sell. But there were no such buyers, he argued.
Refiner Acquisition Cost, 1996-2002 It used to be said that OPEC has a target price range. mt prefers a description that Saudis are price setters, and other OPEC countries accept that price, without significant production Changes..
Gulf Oil Source: Longrigg (1967) Oil in the Middle East p. 493
Mediterranean Gas Finds Syrian Claim Lebanon’s Claim Disputed between Lebanon & Israel Israeli Claim Egyptian Claim Palestinian Claim Source: AntreasyanJournal of Palestine Studies Spring, 2013
Green is Oil, Red is Gas Europe & Russia: Petroleum Economist
New Energy Pipelines for Europe Source: Der Spiegel online, March 14, 2010
Oil & Gas: MENA & North Africa. Petroleum Economist Green is Oil, Red is Gas
North Sea Oil Source: World Oil 2002
Oil and Gas in South-East Asia Source: World Oil 1984
Mexican Oil Source: World Oil, 1984
Colombia and Venezuela Oil Source: World Oil, 2002
Brazil: Off-shore oil. Campos Basin Source: World Oil One mile to the ocean floor, then another mile or two.
Off-shore Petroleum Drilling, Brazil Source: Gail Tverberg (2008) Peak Oil Science Curriculum
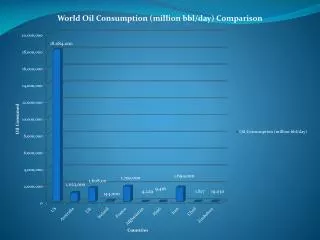
Consumption: Barrels/day/1000 population Highest levels in Gulf countries, (not US and western Europe) Source: US DoE consumption; population from IFS
United States: Petroleum Supply Annual 2003 Others: International Energy Agency, Monthly Data Service, February 10, 2005