Download
1 / 31
310 likes | 516 Views
Pedestrian and Bicycle Safety Education Campaign Review of the FY 2012 Campaign and Planning for FY 2013 Transportation Planning Board Item #11 October 17th, 2012 Jeff Dunckel Pedestrian Safety Coordinator, Montgomery County Chair, Bicycle and Pedestrian Subcommittee.

E N D
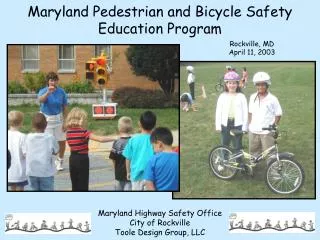
Pedestrian and Bicycle Safety Education Campaign Review of the FY 2012 Campaign and Planning for FY 2013 Transportation Planning Board Item #11 October 17th, 2012 Jeff Dunckel Pedestrian Safety Coordinator, Montgomery County Chair, Bicycle and Pedestrian Subcommittee
Regional Traffic Fatalities Total = 287 *2011 Preliminary data – MHSO, VDMV, DDOT, Montgomery County
Traffic Fatality Trends *2011 Preliminary data – MHSO, VDMV, DDOT, Montgomery County
Pedestrian & Bicyclist Fatalities by Jurisdiction *2011 Preliminary data – MHSO, VDMV, DDOT
What is Street Smart? • Street Smart focuses on Education through Mass Media • One media campaign for one media market • http://bestreetsmart.net • Concentrated waves of Radio, Transit, Cable, and Internet advertising designed to change driver, pedestrian, and cyclist behavior • Since Fall 2002 • Supported by concurrent law enforcement • Funded by: • Federal Funds administered by the States • WMATA • TPB Member Governments • FY 2013: $63k from COG dues, replaces local gov’t contributions • 1.2 cents per capita from all vs. 5 cents per capita from some • Total Budget $623,000, compared to $634,000 in FY 2012
Street Smart Advisory Group • Works with consultant, TPB staff to plan campaign timing, strategy • Reviews and approves all creative materials • Coordinates with local law enforcement • Membership • Previously consisted of representatives of funding agencies – States, WMATA, some TPB Member Jurisdictions • Now open to all agencies paying COG dues • Letters inviting all jurisdictions to participate went out in May
Fall 2011 • November 14 Press Event @ Piney Branch Road in Montgomery County • Coverage Reached 900,000 People • November Media • “Giant Pedestrian Safety Problem” • 2 weeks radio • 1 month transit ads • Law enforcement • October 18 Best Practices in Pedestrian Enforcement Workshop
Spring 2012 Campaign • March 18 – April 14 • $218,000 media budget • Four weeks Cable TV, Outdoor • Two weeks Radio • Weighted Wednesday – Sunday, 3 pm – 8 pm • Press Event • March 28th, 11:30 a.m., in District Heights, MD • Followed by live enforcement - Intersection of Silver Hill Road and Marlboro Pike • Covered on WJLA 7, WUSA 9, WTOP • Law Enforcement in High-Incidence Areas • Prince George’s, Montgomery, Capitol Heights, District of Columbia, Arlington, City of Fairfax, Prince William, others
Spring 2012 Ads Example Ad (Bus Side): Radio Ad: http://www.bestreetsmart.net/
Evaluation • Outreach success • Estimated $1 million value in PSA’s, donated media space, “earned media” • Law enforcement • 3933 Citations and 2088 warnings issued during the campaign • See Annual Report for more details • Pre and post-campaign web-based surveys of area motorists • Awareness of messages, law enforcement, self-reported behaviors • Shows that people remember the messages, and where they heard them • Regional Fatalities and Injuries • Pedestrian & Bicyclist • Complementary Local “Three E” program results • Example: Montgomery County Pedestrian Safety Initiative
Long Term Results • Surveys show improvement over past ten years • Message Awareness • Perceived Law Enforcement • Reported pedestrian, driver behavior • Safety Data Results are Mixed • Pedestrian and Bicyclist Fatalities and Injuries are stable • Motorized Fatalities and Injuries are falling • Proportion of Pedestrian & Bicyclist Fatalities and Injuries is rising • Some jurisdictions have seen improvement. For example, • Montgomery County Pedestrian Safety Initiative • Comprehensive Engineering, Enforcement & Education Program • Uses the Street Smart materials, hosts press event • $4 million/year budget, mostly engineering at high-crash locations • Reduced pedestrian fatalities, serious injuries
Next Steps • New Project Consultant – Sherry Matthews Inc. • Submitted the most highly rated among eight proposals • Long history of public safety campaigns for TX DOT, others • Met with Advisory Group • Developing proposal for FY 2013 • Fresh data on target demographic in the Washington Region • Fresh creative and media approach • Promote partnership with local three “E” efforts • Fall Campaign: November 2012 • Loudoun County has volunteered to host Fall 2012 Press Event • November 14
Injury Trends: 1999-2010 Sources: MDSHA Maryland Highway Safety Office; DDOT 2010 Safety Facts, Virginia Department of Motor Vehicles CAP (Centralized Accident Processing) System
Pedestrian Injuries in the Washington Region Sources: MDSHA Maryland Highway Safety Office; DDOT 2010 Safety Facts, Virginia Department of Motor Vehicles CAP (Centralized Accident Processing) System
Bicyclist Injuries in the Washington Region Sources: MDSHA Maryland Highway Safety Office; DDOT 2010 Safety Facts, Virginia Department of Motor Vehicles CAP (Centralized Accident Processing) System
Daily Walk Trip Share by Jurisdiction (All trips)(1994 – 2007/2008) Source: 1994 and 2007/2008 TPB Household Travel Survey
Marketing Communications Evaluation Results: Spring 2012 Campaign Survey PROvuncular Research & Strategic Insight
Survey Methodology • Web-based standard pre/post-test survey with a sample size of N = 500 per survey. • Pre-survey week of March 19, 2012. • Post-survey week of May 6, 2012. • 50-50 males–females • Sampled from COG membership footprint • All participants are active drivers. • Margin of error is +/- 4%.
Enforcement • Respondents were asked: “Have you recently seen or heard about police efforts to enforce pedestrian safety laws?” • The general audience showed a 10% increase in enforcement awareness from pre- to post-surveys going from 32% to 42%. • Males 18-34 showed sustained high awareness from pre- to post-surveys. Increase of 10 points
Enforcement • Target audience of males aged 18-34 believed driver, bicyclist enforcement increased Increase of 7 points Increase of 7 points
Behaviors • Self-reported risky behaviors show improvement of pedestrian behaviors among 18-34 males while driver behavior remained flat. • Failed to yield to pedestrians: Pre 26% - Post 25% • Jaywalked: Pre 40% - Post 31% • Did not wait for walk sign: Pre 44% - post 35% Decrease of 9 points Decrease of 9 points
Message Awareness • Awareness of the primary enforcement message “Obey pedestrian and traffic safety laws or get tickets, fines or points” increased among the target audience in the post survey. Increase of 7 points Increase of 5 points • .
Message Awareness • When asked have you seen this ad, respondents showed significant recall in the post-survey indicating awareness of the outdoor advertising. Increase of 13 points Increase of 8 points
Progress over time • The Street Smart Program has been conducting pre- and post-surveys since 2002. During the past 10 years, some questions have been consistently asked in the same manner so we’ve been able to do some comparisons. • Total Net Awareness (combined awareness of all campaign messaging): Increase of 24 points
Progress over time • Observations of pedestrians who “frequently” jaywalk: Decrease of 7 points
Progress over time • Observations of drivers who “frequently” do not yield to pedestrians: Decrease of 14 points
Progress over Time • Awareness of police efforts to enforce pedestrian traffic safety laws: Increase of 18 points