Download
1 / 52
520 likes | 605 Views
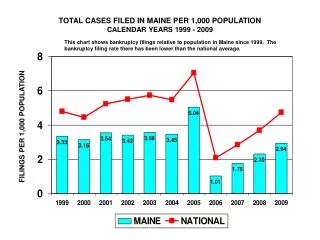
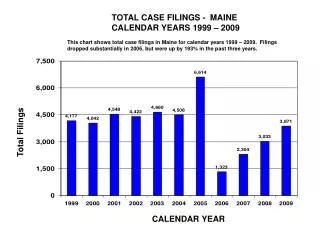
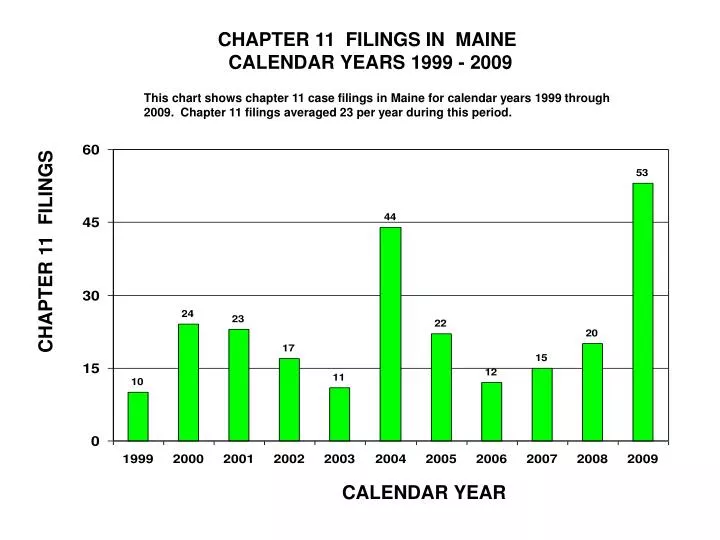
CHAPTER 11 FILINGS IN MAINE CALENDAR YEARS 1999 - 2009 . This chart shows chapter 11 case filings in Maine for calendar years 1999 through 2009. Chapter 11 filings averaged 23 per year during this period. CHAPTER 11 FILINGS. CALENDAR YEAR.

E N D
CHAPTER 11 FILINGS IN MAINE CALENDAR YEARS 1999 - 2009 This chart shows chapter 11 case filings in Maine for calendar years 1999 through 2009. Chapter 11 filings averaged 23 per year during this period. CHAPTER 11 FILINGS CALENDAR YEAR
CHAPTER 11 FILINGS IN MASSACHUSETTS CALENDAR YEARS 1999 – 2009 This chart shows chapter 11 case filings in Massachusetts for calendar years 1999 through 2009. Chapter 11 filings averaged 171 per year during this period. CHAPTER 11 FILINGS CALENDAR YEAR
CHAPTER 11 FILINGS IN NEW HAMPSHIRE CALENDAR YEARS 1999 – 2009 This chart shows chapter 11 case filings in New Hampshire for calendar years 1999 through 2009. Chapter 11 filings averaged 26 per year during this period. CHAPTER 11 FILINGS CALENDAR YEAR
CHAPTER 11 FILINGS IN RHODE ISLAND CALENDAR YEARS 1999 – 2009 This chart shows chapter 11 case filings in Rhode Island for calendar years 1999 through 2009. Chapter 11 filings averaged 12 per year during this period. CHAPTER 11 FILINGS CALENDAR YEAR
CHAPTER 11 FILINGS IN PUERTO RICO CALENDAR YEARS 1999 – 2009 This chart shows chapter 11 case filings in Puerto Rico for calendar years 1999 through 2009. Chapter 11 filings averaged 113 per year during this period. CHAPTER 11 FILINGS CALENDAR YEAR
CHAPTER 11 FILINGS IN CONNECTICUT CALENDAR YEARS 1999 – 2009 This chart shows chapter 11 case filings in Connecticut for calendar years 1999 through 2009. Chapter 11 filings averaged 100 per year during this period. CHAPTER 11 FILINGS CALENDAR YEAR
CHAPTER 11 FILINGS IN NEW YORK CALENDAR YEARS 1999 – 2009 This chart shows chapter 11 case filings in New York for calendar years 1999 through 2009. Chapter 11 filings averaged 1,294 per year during this period. CHAPTER 11 FILINGS CALENDAR YEAR
CHAPTER 11 FILINGS IN VERMONT CALENDAR YEARS 1999 – 2009 This chart shows chapter 11 case filings in Vermont for calendar years 1999 through 2009. Chapter 11 filings averaged 5 per year during this period. CHAPTER 11 FILINGS CALENDAR YEAR
CHAPTER 11 FILINGS IN DELAWARE CALENDAR YEARS 1999 – 2009 This chart shows chapter 11 case filings in Delaware for calendar years 1999 through 2009. Chapter 11 filings averaged 912 per year during this period. CHAPTER 11 FILINGS CALENDAR YEAR
CHAPTER 11 FILINGS IN NEW JERSEY CALENDAR YEARS 1999 – 2009 This chart shows chapter 11 case filings in New Jersey for calendar years 1999 through 2009. Chapter 11 filings averaged 346 per year during this period. CHAPTER 11 FILINGS CALENDAR YEAR
CHAPTER 11 FILINGS IN PENNSYLVANIA CALENDAR YEARS 1999 – 2009 This chart shows chapter 11 case filings in Pennsylvania for calendar years 1999 through 2009. Chapter 11 filings averaged 336 per year during this period. CHAPTER 11 FILINGS CALENDAR YEAR
CHAPTER 11 FILINGS IN MARYLAND CALENDAR YEARS 1999 – 2009 This chart shows chapter 11 case filings in Maryland for calendar years 1999 through 2009. Chapter 11 filings averaged 191 per year during this period. CHAPTER 11 FILINGS CALENDAR YEAR
CHAPTER 11 FILINGS IN NORTH CAROLINA CALENDAR YEARS 1999 – 2009 This chart shows chapter 11 case filings in North Carolina for calendar years 1999 through 2009. Chapter 11 filings averaged 149 per year during this period. CHAPTER 11 FILINGS CALENDAR YEAR
CHAPTER 11 FILINGS IN SOUTH CAROLINA CALENDAR YEARS 1999 – 2009 This chart shows chapter 11 case filings in South Carolina for calendar years 1999 through 2009. Chapter 11 filings averaged 68 per year during this period. CHAPTER 11 FILINGS CALENDAR YEAR
CHAPTER 11 FILINGS IN VIRGINIA CALENDAR YEARS 1999 – 2009 This chart shows chapter 11 case filings in Virginia for calendar years 1999 through 2009. Chapter 11 filings averaged 177 per year during this period. CHAPTER 11 FILINGS CALENDAR YEAR
CHAPTER 11 FILINGS IN WEST VIRGINIA CALENDAR YEARS 1999 – 2009 This chart shows chapter 11 case filings in West Virginia for calendar years 1999 through 2009. Chapter 11 filings averaged 48 per year during this period. CHAPTER 11 FILINGS CALENDAR YEAR
CHAPTER 11 FILINGS IN LOUISIANA CALENDAR YEARS 1999 – 2009 This chart shows chapter 11 case filings in Louisiana for calendar years 1999 through 2009. Chapter 11 filings averaged 128 per year during this period. CHAPTER 11 FILINGS CALENDAR YEAR
CHAPTER 11 FILINGS IN MISSISSIPPI CALENDAR YEARS 1999 – 2009 This chart shows chapter 11 case filings in Mississippi for calendar years 1999 through 2009. Chapter 11 filings averaged 73 per year during this period. CHAPTER 11 FILINGS CALENDAR YEAR
CHAPTER 11 FILINGS IN TEXAS CALENDAR YEARS 1999 – 2009 This chart shows chapter 11 case filings in Texas for calendar years 1999 through 2009. Chapter 11 filings averaged 788 per year during this period. CHAPTER 11 FILINGS CALENDAR YEAR
CHAPTER 11 FILINGS IN KENTUCKY CALENDAR YEARS 1999 – 2009 This chart shows chapter 11 case filings in Kentucky for calendar years 1999 through 2009. Chapter 11 filings averaged 96 per year during this period. CHAPTER 11 FILINGS CALENDAR YEAR
CHAPTER 11 FILINGS IN MICHIGAN CALENDAR YEARS 1999 – 2009 This chart shows chapter 11 case filings in Michigan for calendar years 1999 through 2009. Chapter 11 filings averaged 222 per year during this period. CHAPTER 11 FILINGS CALENDAR YEAR
CHAPTER 11 FILINGS IN OHIO CALENDAR YEARS 1999 – 2009 This chart shows chapter 11 case filings in Ohio for calendar years 1999 through 2009. Chapter 11 filings averaged 189 per year during this period. CHAPTER 11 FILINGS CALENDAR YEAR
CHAPTER 11 FILINGS IN TENNESSEE CALENDAR YEARS 1999 – 2009 This chart shows chapter 11 case filings in Tennessee for calendar years 1999 through 2009. Chapter 11 filings averaged 275 per year during this period. CHAPTER 11 FILINGS CALENDAR YEAR
CHAPTER 11 FILINGS IN ILLINOIS CALENDAR YEARS 1999 – 2009 This chart shows chapter 11 case filings in Illinois for calendar years 1999 through 2009. Chapter 11 filings averaged 286 per year during this period. CHAPTER 11 FILINGS CALENDAR YEAR
CHAPTER 11 FILINGS IN INDIANA CALENDAR YEARS 1999 – 2009 This chart shows chapter 11 case filings in Indiana for calendar years 1999 through 2009. Chapter 11 filings averaged 135 per year during this period. CHAPTER 11 FILINGS CALENDAR YEAR
CHAPTER 11 FILINGS IN WISCONSIN CALENDAR YEARS 1999 – 2009 This chart shows chapter 11 case filings in Wisconsin for calendar years 1999 through 2009. Chapter 11 filings averaged 65 per year during this period. CHAPTER 11 FILINGS CALENDAR YEAR
CHAPTER 11 FILINGS IN ARKANSAS CALENDAR YEARS 1999 – 2009 This chart shows chapter 11 case filings in Arkansas for calendar years 1999 through 2009. Chapter 11 filings averaged 51 per year during this period. CHAPTER 11 FILINGS CALENDAR YEAR
CHAPTER 11 FILINGS IN IOWA CALENDAR YEARS 1999 – 2009 This chart shows chapter 11 case filings in Iowa for calendar years 1999 through 2009. Chapter 11 filings averaged 20 per year during this period. CHAPTER 11 FILINGS CALENDAR YEAR
CHAPTER 11 FILINGS IN MINNESOTA CALENDAR YEARS 1999 – 2009 This chart shows chapter 11 case filings in Minnesota for calendar years 1999 through 2009. Chapter 11 filings averaged 64 per year during this period. CHAPTER 11 FILINGS CALENDAR YEAR
CHAPTER 11 FILINGS IN MISSOURI CALENDAR YEARS 1999 – 2009 This chart shows chapter 11 case filings in Missouri for calendar years 1999 through 2009. Chapter 11 filings averaged 96 per year during this period. CHAPTER 11 FILINGS CALENDAR YEAR
CHAPTER 11 FILINGS IN NEBRASKA CALENDAR YEARS 1999 – 2009 This chart shows chapter 11 case filings in Nebraska for calendar years 1999 through 2009. Chapter 11 filings averaged 36 per year during this period. CHAPTER 11 FILINGS CALENDAR YEAR
CHAPTER 11 FILINGS IN NORTH DAKOTA CALENDAR YEARS 1999 – 2009 This chart shows chapter 11 case filings in North Dakota for calendar years 1999 through 2009. Chapter 11 filings averaged 5 per year during this period. CHAPTER 11 FILINGS CALENDAR YEAR
CHAPTER 11 FILINGS IN SOUTH DAKOTA CALENDAR YEARS 1999 – 2009 This chart shows chapter 11 case filings in South Dakota for calendar years 1999 through 2009. Chapter 11 filings averaged 7 per year during this period. CHAPTER 11 FILINGS CALENDAR YEAR
CHAPTER 11 FILINGS IN ALASKA CALENDAR YEARS 1999 – 2009 This chart shows chapter 11 case filings in Alaska for calendar years 1999 through 2009. Chapter 11 filings averaged 14 per year during this period. CHAPTER 11 FILINGS CALENDAR YEAR
CHAPTER 11 FILINGS IN ARIZONA CALENDAR YEARS 1999 – 2009 This chart shows chapter 11 case filings in Arizona for calendar years 1999 through 2009. Chapter 11 filings averaged 299 per year during this period. CHAPTER 11 FILINGS CALENDAR YEAR
CHAPTER 11 FILINGS IN CALIFORNIA CALENDAR YEARS 1999 – 2009 This chart shows chapter 11 case filings in California for calendar years 1999 through 2009. Chapter 11 filings averaged 896 per year during this period. CHAPTER 11 FILINGS CALENDAR YEAR
CHAPTER 11 FILINGS IN HAWAII CALENDAR YEARS 1999 – 2009 This chart shows chapter 11 case filings in Hawaii for calendar years 1999 through 2009. Chapter 11 filings averaged 22 per year during this period. CHAPTER 11 FILINGS CALENDAR YEAR
CHAPTER 11 FILINGS IN IDAHO CALENDAR YEARS 1999 – 2009 This chart shows chapter 11 case filings in Idaho for calendar years 1999 through 2009. Chapter 11 filings averaged 39 per year during this period. CHAPTER 11 FILINGS CALENDAR YEAR
CHAPTER 11 FILINGS IN MONTANA CALENDAR YEARS 1999 – 2009 This chart shows chapter 11 case filings in Montana for calendar years 1999 through 2009. Chapter 11 filings averaged 17 per year during this period. CHAPTER 11 FILINGS CALENDAR YEAR
CHAPTER 11 FILINGS IN NEVADA CALENDAR YEARS 1999 – 2009 This chart shows chapter 11 case filings in Nevada for calendar years 1999 through 2009. Chapter 11 filings averaged 180 per year during this period. CHAPTER 11 FILINGS CALENDAR YEAR
CHAPTER 11 FILINGS IN OREGON CALENDAR YEARS 1999 – 2009 This chart shows chapter 11 case filings in Oregon for calendar years 1999 through 2009. Chapter 11 filings averaged 41 per year during this period. CHAPTER 11 FILINGS CALENDAR YEAR
CHAPTER 11 FILINGS IN WASHINGTON CALENDAR YEARS 1999 – 2009 This chart shows chapter 11 case filings in Washington for calendar years 1999 through 2009. Chapter 11 filings averaged 180 per year during this period. CHAPTER 11 FILINGS CALENDAR YEAR
CHAPTER 11 FILINGS IN COLORADO CALENDAR YEARS 1999 – 2009 This chart shows chapter 11 case filings in Colorado for calendar years 1999 through 2009. Chapter 11 filings averaged 100 per year during this period. CHAPTER 11 FILINGS CALENDAR YEAR
CHAPTER 11 FILINGS IN KANSAS CALENDAR YEARS 1999 – 2009 This chart shows chapter 11 case filings in Kansas for calendar years 1999 through 2009. Chapter 11 filings averaged 40 per year during this period. CHAPTER 11 FILINGS CALENDAR YEAR
CHAPTER 11 FILINGS IN NEW MEXICO CALENDAR YEARS 1999 – 2009 This chart shows chapter 11 case filings in New Mexico for calendar years 1999 through 2009. Chapter 11 filings averaged 40 per year during this period. CHAPTER 11 FILINGS CALENDAR YEAR
CHAPTER 11 FILINGS IN OKLAHOMA CALENDAR YEARS 1999 – 2009 This chart shows chapter 11 case filings in Oklahoma for calendar years 1999 through 2009. Chapter 11 filings averaged 59 per year during this period. CHAPTER 11 FILINGS CALENDAR YEAR
CHAPTER 11 FILINGS IN UTAH CALENDAR YEARS 1999 – 2009 This chart shows chapter 11 case filings in Utah for calendar years 1999 through 2009. Chapter 11 filings averaged 64 per year during this period. CHAPTER 11 FILINGS CALENDAR YEAR
CHAPTER 11 FILINGS IN WYOMING CALENDAR YEARS 1999 – 2009 This chart shows chapter 11 case filings in Wyoming for calendar years 1999 through 2009. Chapter 11 filings averaged 13 per year during this period. CHAPTER 11 FILINGS CALENDAR YEAR
CHAPTER 11 FILINGS IN ALABAMA CALENDAR YEARS 1999 – 2009 This chart shows chapter 11 case filings in Alabama for calendar years 1999 through 2009. Chapter 11 filings averaged 139 per year during this period. CHAPTER 11 FILINGS CALENDAR YEAR
CHAPTER 11 FILINGS IN FLORIDA CALENDAR YEARS 1999 – 2009 This chart shows chapter 11 case filings in Florida for calendar years 1999 through 2009. Chapter 11 filings averaged 565 per year during this period. CHAPTER 11 FILINGS CALENDAR YEAR