Download
1 / 33
330 likes | 475 Views
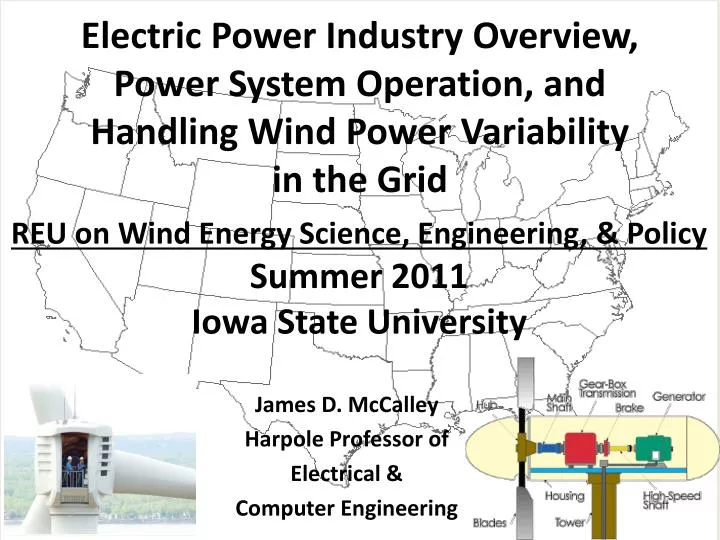
REU on Wind Energy Science, Engineering, & Policy Summer 2011 Iowa State University. Electric Power Industry Overview, Power System Operation, and Handling Wind Power Variability in the Grid. James D. McCalley Harpole Professor of Electrical & Computer Engineering.

E N D
REU on Wind Energy Science, Engineering, & PolicySummer 2011Iowa State University Electric Power Industry Overview, Power System Operation, and Handling Wind Power Variability in the Grid James D. McCalley Harpole Professor of Electrical & Computer Engineering
Outline The electric power industry Control centers Basic problems, potential solutions Wind power equation Variability System Control Comments on potential solutions 2
Organizations comprising the Electric Power Industry • Investor-owned utilities: 210 (MEC, Alliant, Xcel, Exelon, …) • Federally-owned: 10 (TVA, BPA, WAPA, SEPA, APA, SWPA…) • Public-owned: 2009 (Ames, Cedar Falls, Muscatine, …) • Consumer-owned: 883 (Dairyland, CIPCO, Corn Belt, …) • Non-utility power producers: 1934(Alcoa, DuPont,…) • Power marketers: 400 (e.g., Cinergy, Mirant, Illinova, Shell Energy, PECO-Power Team, Williams Energy,…) • Coordination organizations: 10 (ISO-NE, NYISO, PJM, MISO, SPP, ERCOT, CAISO, AESO, NBSO) • Oversight organizations: • Regulatory: 52 state, 1 Fed (FERC) • Reliability: 1 National (NERC), 8 regional entities • Environment: 52 state (DNR), 1 Fed (EPA) • Manufacturers: GE, ABB, Toshiba, Schweitzer, Westinghouse,… • Consultants: Black&Veatch, Burns&McDonnell, HD Electric,… • Vendors: Siemens, Areva, OSI,… • Govt agencies: DOE, National Labs,… • Professional organizations: IEEE PES … • Advocacy organizations:AEWA, IWEA, Wind on Wires… • Trade Associations: EEI, EPSA, NAESCO, NRECA, APPA, PMA,… • Law-making bodies: 52 state legislatures, US Congress 3
Transmission and System Operator G G G G G G G G G G G G Independent System Operator G Transmission Operator Transmission Operator Transmission Operator G Today G G Independent System Operator Vertically Integrated Utility 1900-1996/2000 5
What are ISOs? • The regional system operator: monitors and controls grid in real-time • The regional market operator: monitors and controls the electricity markets • The regional planner: coordinates the 5 and 10 year planning efforts • Also the Regional Transmission Organization (RTO) • They do not own any electric power equipment! • None of them existed before 1996! • California ISO (CAISO) • Midwest ISO (MISO) • Southwest Power Pool (SPP) • Electric Reliability Council of Texas (ERCOT) • New York ISO (NYISO) • ISO-New England (ISO-NE) • Pennsylvania-Jersey-Maryland (PJM) 6
What are the North American Interconnections? “Synchronized” 7
What is NERC? • NERC: The North American Reliability Corporation, certified by federal government (FERC) as the “electric reliability organization” for the United States. • Overriding responsibility is to maintain North American bulk transmission/generation reliability. Specific functions include maintaining standards, monitoring compliance and enforcing penalties, performing reliability assessments, performing event analysis, facilitating real-time situational awareness, ensuring infrastructure security, trains/certifies system operators. • There are eight NERC regional councils (see below map) who share NERC’s mission for their respective geographies within North America through formally delegated enforcement authority • Western Electricity Coordinating Council (WECC) • Midwest Reliability Organization (MRO) • Southwest Power Pool (SPP) • Texas Reliability Entity (TRE) • Reliability First Corporation (RFC) • Southeast Electric Reliability Council (SERC) • Florida Reliability Coordinating Council (FRCC) • Northeast Power Coordinating Council (NPCC) 8
What is a Balancing Authority (BA)? • From NERC: A BA is the responsible entity that integrates resource plans ahead of time, maintains load-interchange-generation balance within a Balancing Authority Area, and supports Interconnection frequency in real time. This means it is the organization responsible for performing the load/generation balancing function. • All ISOs are BAs but many BAs are not ISOs. • Main functions of BA: unit commitment, dispatch, Automatic Gen Control (AGC). • Unit commitment: Determine in the next time interval (week, 2 day, 24 hrs, 4 hrs) which gen units should be connected (synchronized). • Dispatch: Determine in the next time interval (1 hr, 15 mins, 5 mins), what should be the MW output for each committed gen unit. • AGC: Maintain frequency at 60Hz in the interconnection, ensure load changes in the BA are met by gen changes in the BA, maintain tie line flows at scheduled levels. 9
Energy Control Centers • Energy Control Center (ECC): • SCADA, EMS, operational personnel • “Heart” (eyes & hands, brains) of the power system • Supervisory control & data acquisition (SCADA): • Supervisory control: remote control of field devices, including gen • Data acquisition: monitoring of field conditions • SCADA components: • Master Station: System “Nerve Center” located in ECC • Remote terminal units: Gathers data at substations; sends to Master Station • Communications: Links Master Station with Field Devices, telemetry is done by either leased wire, PLC, microwave, or fiber optics. • Energy management system (EMS) • Topology processor & network configurator • State estimator and power flow model development • Automatic generation control (AGC), Optimal power flow (OPF) • Security assessment and alarm processing 10
ECCs: EMS & SCADA Remote terminal unit Substation SCADA Master Station Communication link Energy control center with EMS EMS alarm display EMS 1-line diagram 11
Electricity “two settlement” markets Internet system Energy & reserve offers from gens Day-Ahead Market (every day) Which gens get committed, at roughly what levels for next 24 hours, and settlement Energy bids from loads Energy offers from gens Internet system Generation levels for next 5 minutes and settlement for deviations from day-ahead market Real-Time Market (every 5 minutes) Energy bids from loads 15
Basic problems with wind & power balance Wind is a variable resource when maximizing energy production Definition: NETLOAD.MW=LOAD.MW-WIND.MW Fact: Wind increases NETLOAD.MW variability in grid Fact: Grid requires GEN.MW=NETLOAD.MW always Fact: “Expensive” gens move (ramp) quickly, “cheap” gens don’t, some gens do not ramp at all. Problem: Increasing wind increases need for more and “faster” resources to meet variability, increasing cost of wind. Wind is an uncertain resource Fact: Market makes day-ahead decisions for “unit commitment” (UC) based on NETLOAD.MW forecast. Fact: Large forecast error requires available units compensate. Problem: Too many (under-forecast) or too few (over-forecast) units may be available, increasing the cost of wind. 16
Groups of 2-3, 5 minutes • Identify your preferred approach to the variability problem • Consider the below solutions, one, or combination, or other • Identify reasons (e.g., economics, effectiveness, sustainability) and have one person report to class at end of 10 minutes Solutions to variability & uncertainty We have always dealt with variability and uncertainty in the load, so no changes are needed. Increase MW control capability during periods of expected high variability via control of the wind power. Increase MW control capability during periods of expected high variability via more conventional generation. Increase MW control capability during periods of expected high variability using demand control. Increase MW control capability during periods of expected high variability using storage. 17
Power production Wind power equation Mass flow rate is the mass of substance which passes through a given surface per unit time. Swept area At of turbine blades: • The disks have larger cross sectional area from left to right because • v1 > vt > v2 and • the mass flow rate must be the same everywhere within the streamtube: • ρ=air density (kg/m3) • Therefore, A 1 < At < A 2 v1 vt v2 v x 18
Power production Wind power equation 2. Air mass flowing: 1. Wind velocity: 3. Mass flow rate at swept area: 4b. Force on turbine blades: 4a. Kinetic energy change: 5b. Power extracted: 5a. Power extracted: 6b. Substitute (3) into (5b): 6a. Substitute (3) into (5a): 7. Equate 8. Substitute (7) into (6b): 9. Factor out v13: 19
Power production Wind power equation 10. Define wind stream speed ratio, a: This ratio is fixed for a given turbine & control condition. 11. Substitute a into power expression of (9): 12. Differentiate and find a which maximizes function: 13. Find the maximum power by substituting a=1/3 into (11): 20
Power production Wind power equation 14. Define Cp, the power (or performance) coefficient, which gives the ratio of the power extracted by the converter, P, to the power of the air stream, Pin. power extracted by the converter power of the air stream 15. The maximum value of Cp occurs when its numerator is maximum, i.e., when a=1/3: The Betz Limit! 21
Power production Cp vs. λ and θ u: tangential velocity of blade tip Tip-speed ratio: ω: rotational velocity of blade R: rotor radius v1: wind speed Pitch: θ GE SLE 1.5 MW 22
Power production Wind Power Equation • So power extracted depends on • Design factors: • Swept area, At • Environmental factors: • Air density, ρ (~1.225kg/m3 at sea level) • Wind speed v3 • 3. Control factors affecting performance coefficient CP: • Tip speed ratio through the rotor speed ω • Pitch θ 23
Power production Cp vs. λ and θ u: tangential velocity of blade tip Tip-speed ratio: ω: rotational velocity of blade R: rotor radius • Important concept #1: • The control strategy of all US turbines today is to operate turbine at point of maximum energy extraction, as indicated by the locus of points on the black solid line in the figure. • Important concept #2: • This strategy maximizes the energy produced by a given wind turbine. • Any other strategy “spills” wind !!! • Important concept #3: • Cut-in speed>0 because blades need minimum torque to rotate. • Generator should not exceed rated power • Cut-out speed protects turbine in high winds v1: wind speed GE SLE 1.5 MW 24
Power production Usable speed range Cut-in speed (6.7 mph) Cut-out speed (55 mph) 25
Wind Power Temporal & Spatial Variability JULY2006 JANUARY2006 Blue~VERY LOW POWER; Red~VERY HIGH POWER • Notice the temporal variability: • lots of cycling between blue and red; • January has a lot more high-wind power (red) than July; • Notice the spatial variability • “waves” of wind power move through the entire Eastern Interconnection; • red occurs more in the Midwest than in the East 26
= + Load Following Regulation MW-Hz Time Frames Source: Steve Enyeart, “Large Wind Integration Challenges for Operations / System Reliability,” presentation by Bonneville Power Administration, Feb 12, 2008, available at http://cialab.ee.washington.edu/nwess/2008/presentations/stephen.ppt. 27
How Does Power System Handle Variability Turbine-Gen N Turbine-Gen … Turbine-Gen 2 Turbine-Gen 1 ACE=∆Ptie +B∆f Primary control provides regulation Secondary control provides load following ∆f ∆Ptie 29
30 Characterizing Netload Variability ∆T HISTOGRAM Measure each ∆T variation for 1 yr (∆T=1min, 5min, 1 hr) Identify “variability bins” in MW Count # of intervals in each variability bin Plot # against variability bin Compute standard deviation σ. Regulation Load following Loads: 2011: 12600 MW 2013: 12900 MW 2018: 13700 MW Ref: Growing Wind; Final Report of the NYISO 2010 Wind Generation Study, Sep 2010. www.nyiso.com/public/webdocs/newsroom/press_releases/2010/GROWING_WIND_-_Final_Report_of_the_NYISO_2010_Wind_Generation_Study.pdf
Do nothing: fossil-plants provide reg & LF (and die ). • Increase control of the wind generation • Provide wind with primary control • Reg down (4%/sec), but spills wind following the control • Reg up, but spills wind continuously • Limit wind generation ramp rates • Limit of increasing ramp is easy to do • Limit of decreasing ramp is harder, but good forecasting can warn of impending decrease and plant can begin decreasing in advance • Increase non-wind MW ramping capability during periods of expected high variability using one or more of the below: • Conventional generation • Load control • Storage • Expand control areas Solutions to variability & uncertainty 31
Why Does Variability Matter? • NERC penalties for poor-performance • Consequences of increased frequency variblty: • Some loads may lose performance (induction motors) • Relays can operate to trip loads (UFLS), and gen (V/Hz) • Lifetime reduction of turbine blades • Frequency dip may increase for given loss of generation • Areas without wind may regulate for windy areas • Consequences of increased ACE variability (more frequent MW corrections): • Increased inadvertent flows • Increase control action of generators • Regulation moves “down the stack,” cycling! 32
First, primary frequency control for over-frequency conditions, which requires generation reduction, can be effectively handled by pitching the blades and thus reducing the power output of the machine. Although this action “spills” wind, it is effective in providing the necessary frequency control. Second, primary frequency control for under-frequency conditions requires some “headroom” so that the wind turbine can increase its power output. This means that it must be operating below its maximum power production capability on a continuous basis. This also implies a “spilling” of wind. Question: Should we “spill” wind in order to provide frequency control, in contrast to using all wind energy and relying on some other means to provide the frequency control? Answer: Need to compare system economics between increased production costs from spilled wind, and increased investment, maint, & production costs from using storage & conventional gen. How to decide? 33