Download
1 / 32
330 likes | 541 Views
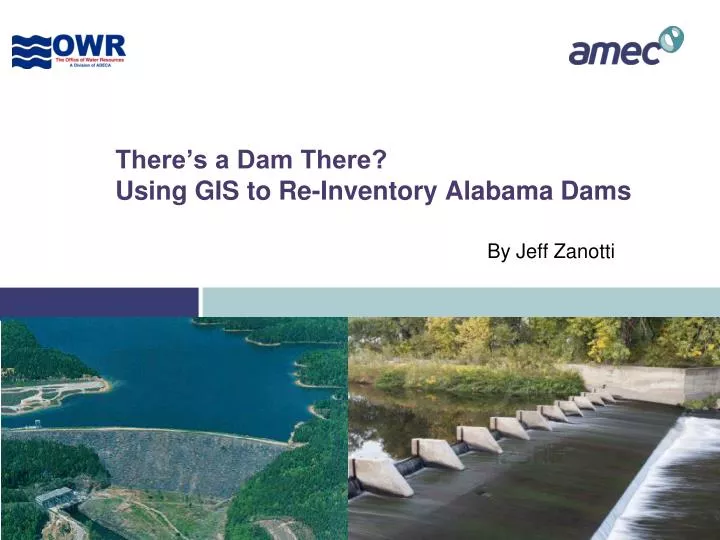
There’s a Dam There? Using GIS to Re-Inventory Alabama Dams. By Jeff Zanotti. Normal Neighborhood in Cullman. Dam Directly Uphill. Decatur. Unmarked Dam. Rainsville. Dam Breach Potential Risks. Dam Failure Risk: 1] Potential of failure 2] Potential damage Potential of failure

E N D
There’s a Dam There?Using GIS to Re-Inventory Alabama Dams By Jeff Zanotti
Dam Breach Potential Risks Dam Failure Risk: 1] Potential of failure 2] Potential damage Potential of failure • Age of dam • Construction deficiencies • Inadequate maintenance • Seismic and weather events Apart from seismic and weather events age is a leading indicator of dam failure.
Recent Regional Failures of Large Dams • Big Bay Dam • Earthern dam near Purvis, MS • March 12, 2004 • Destruction: • 55 homes and mobile homes were destroyed • 104 structures were documented as destroyed or damaged • 0 fatalities
Recent Regional Failures of Large Dams • Kelly Barnes Dam • Earthern embankment dam in Stephens County, GA • November 6, 1977 • Destruction: • 27 homes and mobile homes were destroyed • 2 college buildings were destroyed • 39 fatalities
Dam Safety Programs • Association of State Dam Safety Officials (ASDSO) started in 1984 to create a national organization to improve dam safety • Alabama is the only state that lacks a dam safety program
Safe Dams ADECA’s Office of Water Resources began efforts in 2008 to develop an inventory of dams in Alabama These dams would be classified by their hazard potential Once established the program will help public safety and emergency response operations in the event of a disaster
How to Start the Re-Inventory Process • What is already inventoried? • National Inventory of Dams (NID) Database • What are the resources available? • GIS Layers • What attributes of the dams should be reflected in the inventory? • Goal is to classify by potential hazard
National Inventory of Dams • NID has many of the largest dams in Alabama but suffers from drawbacks of a national dataset • Many dam locations are off spatially by a significant distance or have points that do not correspond to any existing dam • Underestimates the true number of potentially hazardous dams in Alabama
Utilization of GIS Resources • Aerials → NAIP aerials available for free download and/or Base Map imagery layers in ArcGIS 10 • Existing Shapefiles • USGS Quadrangles Layer → used as a way to divide up Alabama into study areas • National Hydrology Dataset → stream centerlines to verify stream flow • DFIRM Databases → includes flood zones to show extent of flooding effects in area • Seamless USGS 7.5 Minute Topographic Maps → available for free through services.arcgisonline.com • USGS 10 Meter Digital Elevation Models (DEMs) → assists in portraying drainage area as well as assisting in possible flooding extents for more difficult areas
Identifying Risk Attributes • What is the maximum storage in volume the dam can contain? • How tall is the dam? • Is there a risk downstream of the dam?
Locating Visually • Study Area Logistics • Study areas broken up by quads • 48 subsections to each quad • Aerial Identification • 3 acres with a hazard less than ½ mile downstream • Greater than 10 acres • Hazard Verification • Use NHD, DEM, and/or DFIRM flood zones to verify hazard potential
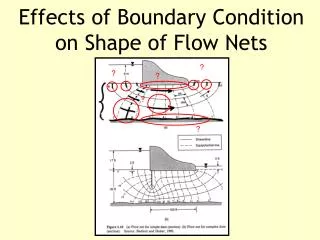
Calculating Height in GIS • H1 = Height of water at normal pool (assumed to be 3 feet lower than top of dam) • H2 = Difference in contours of those immediately downstream of dam and immediately upstream of visible water in pond • D1 = Distance from dam to upstream end of stream line for visible water • D2 = Distance between the 2 contours used to calculate H2
Calculating Volume and Area in GIS • H1 = previously calculated height 3 feet below top of dam • AW = area of visible surface water as measured in GIS from aerial • ATOD = area of surface water at full pool • VTOD = volume for the pond at full pool
Assumptions for Calculating Height/Area/Volume Pools are at normal elevation Stream gradient under the pond is the same as the stream gradient beyond the pool 3 feet in elevation between normal pool and top of dam Depth vs. Area is a linear relationship Volume = 0.4 x top of dam depth x top of dam area for full pool
DEM Usage • DEMs were required to add in supplemental information about the dams like calculating drainage area for watershed ponds • Helped designate dams as having a hazard or not downstream in areas without flood zones
QA/QC • Since GIS can use queries to field calculate most of the values only the D1, D2, and H2, as well as the drainage area and dam length, had to be recorded in the initial review. • Spatial Database Engine (SDE) was used to actually draw the D1 and D2 as their own layers in one dataset so it would be available to the GIS specialist doing the initial inventory as well as the reviewer for edits at the same time • Reviewer focus: • Making sure all dams were accounted for per quad • Hazards are verified • Dam location orientation is correct (using DEM) • D1, D2, and H2 all make sense to ensure accurate estimations
Trouble Areas USGS topos and aerials do not match up making D1 and D2 seem shifted
Trouble Areas Accounting for dry storage
Trouble Areas Unrealistic height estimations from USGS topos
Results • NID points are outdated and did not represent true number of dams with potential hazards • Volume and Height estimations allow OWR to propose new inclusions into the NID • OWR can further classify these inventoried dams by risk and perform field verifications on the most essential dams as needed
Qualifications for Inclusion into NID Has an impounding capacity at maximum water storage elevation of at least 50 acre-feet Exceeds 25 feet or more in height Will create a probable loss of human life in the event of failure or improper operation, regardless of height or storage capacity. (High Hazard) Will create a probable loss of critical infrastructure in the event of failure or improper operation, regardless of height or storage capacity. (Significant or Moderate Hazard)